


USD/JPY Analysis and Chart

The mid-to-end of May sell-off in the US dollar looks like it has run its course with the USD basket pushing higher from its multi-week 101.10 low print. Last Friday’s stronger-than-expected US Jobs Report (NFP) added extra impetus to the move, and thoughts of ever-higher interest rates, as the Fed tries to get a grip on runaway inflation. US Treasury yields continue to move higher with the benchmark UST 10-year now offered with a yield in excess of 3%. US bond yields are seen rising further, adding to the greenback’s attraction against lower-yielding currencies, in particular the Japanese Yen.
EUR/JPY Forecast – Technical Break Higher Looks Convincing
Trade Smarter - Sign up for the DailyFX Newsletter
Receive timely and compelling market commentary from the DailyFX team
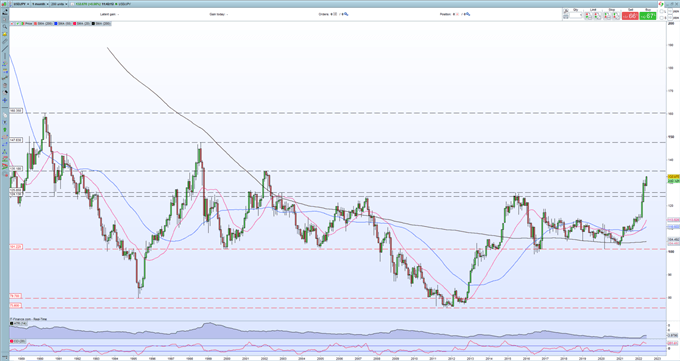
To look at how the Japanese Yen has weakened against the US dollar we need to now use a monthly chart to find levels of resistance and interest. The confirmed break above 125.00, a level previously used by the Bank of Japan to ‘soft talk’ the pair down, now leaves 135.18 as the next level of note and an achievable target. Above here, if all else remains the same – Fed tightening monetary policy/Japan looser for longer – then there is not much technical resistance on the chart before the August 1998 high at 147.630. While this looks enticing it may be a stretch too far for USD/JPY as pressure from Japan’s main trading partners, namely the US, would be heavy and not without potential political consequences if the exchange rate gave one side too much of a trade advantage.
USD/JPY Monthly Price Chart – June 7, 2022
Retail trader data show 28.54% of traders are net-long with the ratio of traders short to long at 2.50 to 1. The number of traders net-long is 16.90% higher than yesterday and 12.77% lower from last week, while the number of traders net-short is 3.30% lower than yesterday and 17.69% higher from last week.
We typically take a contrarian view to crowd sentiment, and the fact traders are net-short suggests USD/JPY prices may continue to rise. Positioning is less net-short than yesterday but more net-short from last week. The combination of current sentiment and recent changes gives us a further mixed USD/JPY trading bias.
| Change in | Longs | Shorts | OI |
| Daily | -2% | 2% | 0% |
| Weekly | 12% | -16% | -6% |
What is your view on the Japanese Yen – bullish or bearish?? You can let us know via the form at the end of this piece or you can contact the author via Twitter @nickcawley1.


