


S&P 500, ASX 200, Fed, Earnings, Chinese Lockdowns, Technical Analysis – Asia Pacific Indices Briefing
- S&P 500 rallies to reverse losses during late-Monday trading session
- Treasury yields cooled, focus may have been on mostly rosy earnings
- ASX 200 reversal risks accelerating amid Chinese Covid lockdowns

Monday’s Wall Street Trading Session Recap
Market sentiment recovered towards the end of Monday’s Wall Street trading session. After falling about 1.6% following the market open, the S&P 500 reversed course to close 0.57% higher in a late-session rally. This is as the Nasdaq 100 and Dow Jones gained 1.36% and 0.7% respectively. The outperformance of the former versus the latter pushed the Nasdaq/Dow ratio higher as 10-year Treasury yields weakened.
This could be a sign of hawkish Federal Reserve expectations slightly fading following a strong week for markets increasingly pricing in 3 consecutive 50-basis point rate hikes. Taking a look at the S&P 500, the top 3 performing sectors were communication services (1.53%), information technology (1.44%) and consumer discretionary (0.78%) – see chart below.
Perhaps traders also welcomed the mostly rosy start to the earnings season. According to Bloomberg, companies within the S&P 500 have thus far seen sales and earnings surprises register at 1.12% and 7.03% respectively. Still, most companies have not yet reported and tech companies are in particular focus after dismal Netflix earnings last week.
S&P 500 Sector Breakdown 4/25/2022
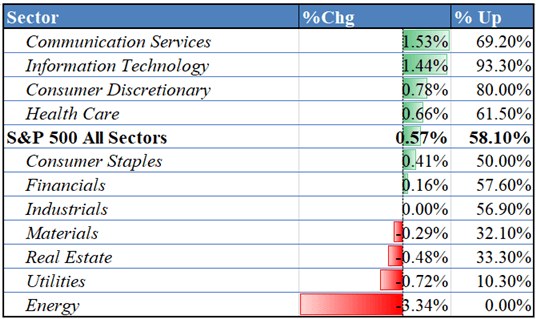
Data Source: Bloomberg
S&P 500 Technical Analysis
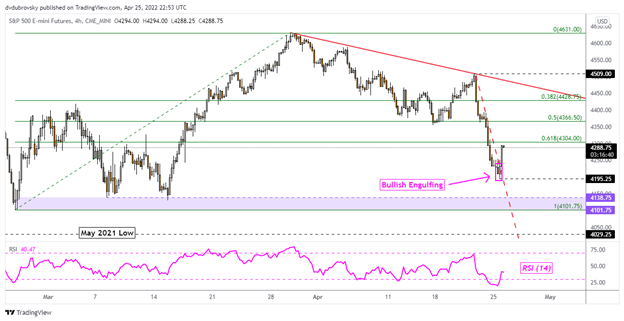
The intraday reversal in S&P 500 futures on the 4-hour chart leaves the index above a near-term falling trendline from the end of last week. This also followed a Bullish Engulfing candlestick pattern, hinting at further gains. Further gains could see the S&P 500 rise to the falling trendline from late March. Otherwise, downtrend resumption exposes the 4101 – 4138 support zone.
Introduction to Technical Analysis
Candlestick Patterns
Recommended by Daniel Dubrovsky
S&P 500 4-Hour Chart
Tuesday’s Asia Pacific Trading Session
With that in mind, the last-minute reversal on Wall Street could set a relatively positive mood for Tuesday’s Asia-Pacific session. A rather lackluster economic docket places the focus on China and its Covid-zero policy. Overnight, the government expanded mass testing in Beijing to 12 districts through the end of this month. This is leaving Australia’s ASX 200 index particularly vulnerable due to close trading relationships between the two countries. The latter has fallen to a monthly low. Still, down the road, increased European demand for Australian goods could perhaps offer some support to the economy.

ASX 200 Technical Analysis
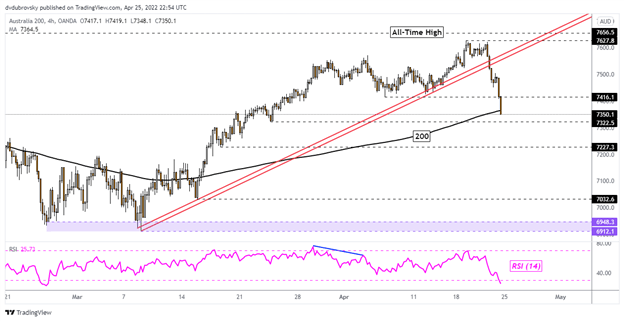
The ASX 200 has extended losses under the rising trendline from March, causing prices to break under the 200-period Simple Moving Average. This could spell further trouble for the Australian benchmark stock index. Taking out 7322 support exposes the March 17th low at 7227 before lows from last month start coming into focus. A push above the 200-period line may open the door to revisiting the former 7416 support level, which may establish itself as new resistance.
ASX 200 4-Hour Chart
--- Written by Daniel Dubrovsky, Strategist for DailyFX.com
To contact Daniel, use the comments section below or @ddubrovskyFX on Twitter
Trade Smarter - Sign up for the DailyFX Newsletter
Receive timely and compelling market commentary from the DailyFX team


