


GOLD FORECAST
XAU/USD FUNDAMENTAL BACKDROP
With optimism around peace talks in Ukraine fading quickly, gold’s safe-haven demand has given the yellow metal some sustenance in the midst of several fundamental headwinds. Beginning with the slump in crude oil, a traditionally positive relationship with gold has led to downward pressure as inflation expectations fall resulting in a rise in real yields (see graphic below). A rise in real yields increase the opportunity cost of holding gold which makes gold less appealing to hold over other assets.
U.S. 10-YEAR REAL YIELD
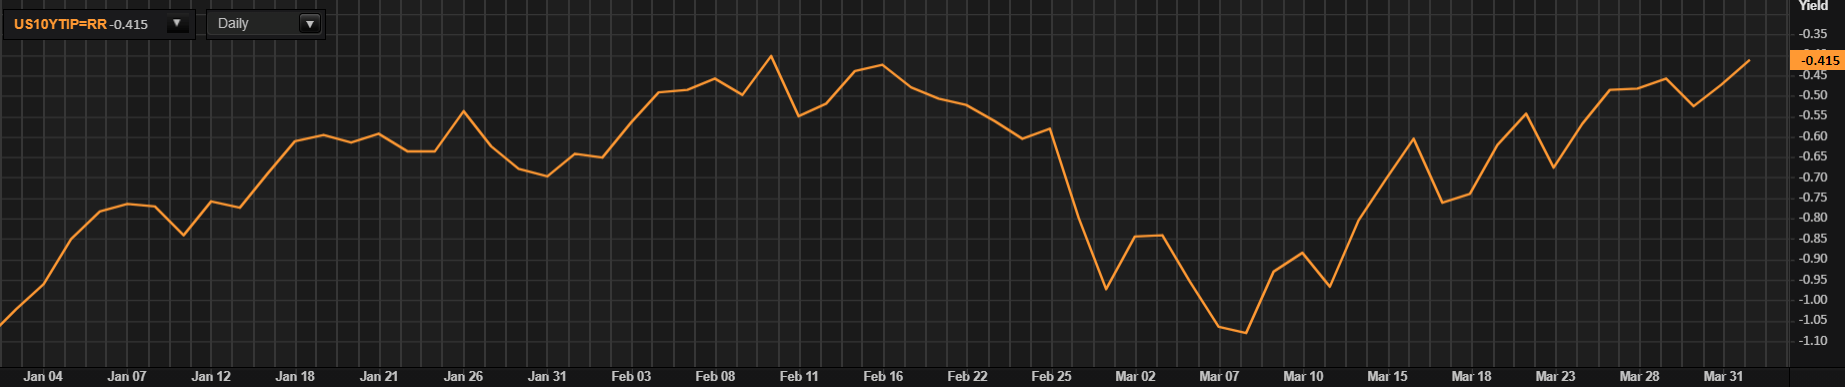
Source: Refinitiv
The dollar is not helping the situation for gold with FX markets flocking to safety via the greenback as risk on sentiment unwinds. The dollar is likely to continue its upward trajectory with an extremely aggressive Fed looking to front load rates. This narrative could be supported later today by strong Non-Farm Payroll (NFP) data which will reinforce the U.S.’s tight labour market. Avergage earnings figures will also play a key role as to the inflationary environment which may give gold some sustenance by means of its debatable inflation hedge characteristic. Shortly after NFP data, ISM Manufacturing PMI which is expected to print higher than previous data could give the dollar additional backing going into the weekend.
ECONOMIC CALENDAR
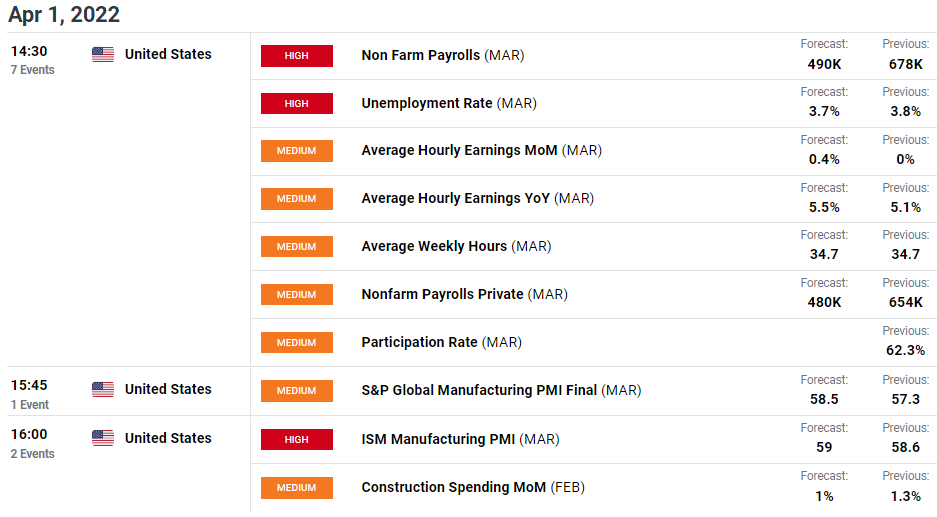
Source: DailyFX Economic Calendar

TECHNICAL ANALYSIS
GOLD PRICE DAILY CHART
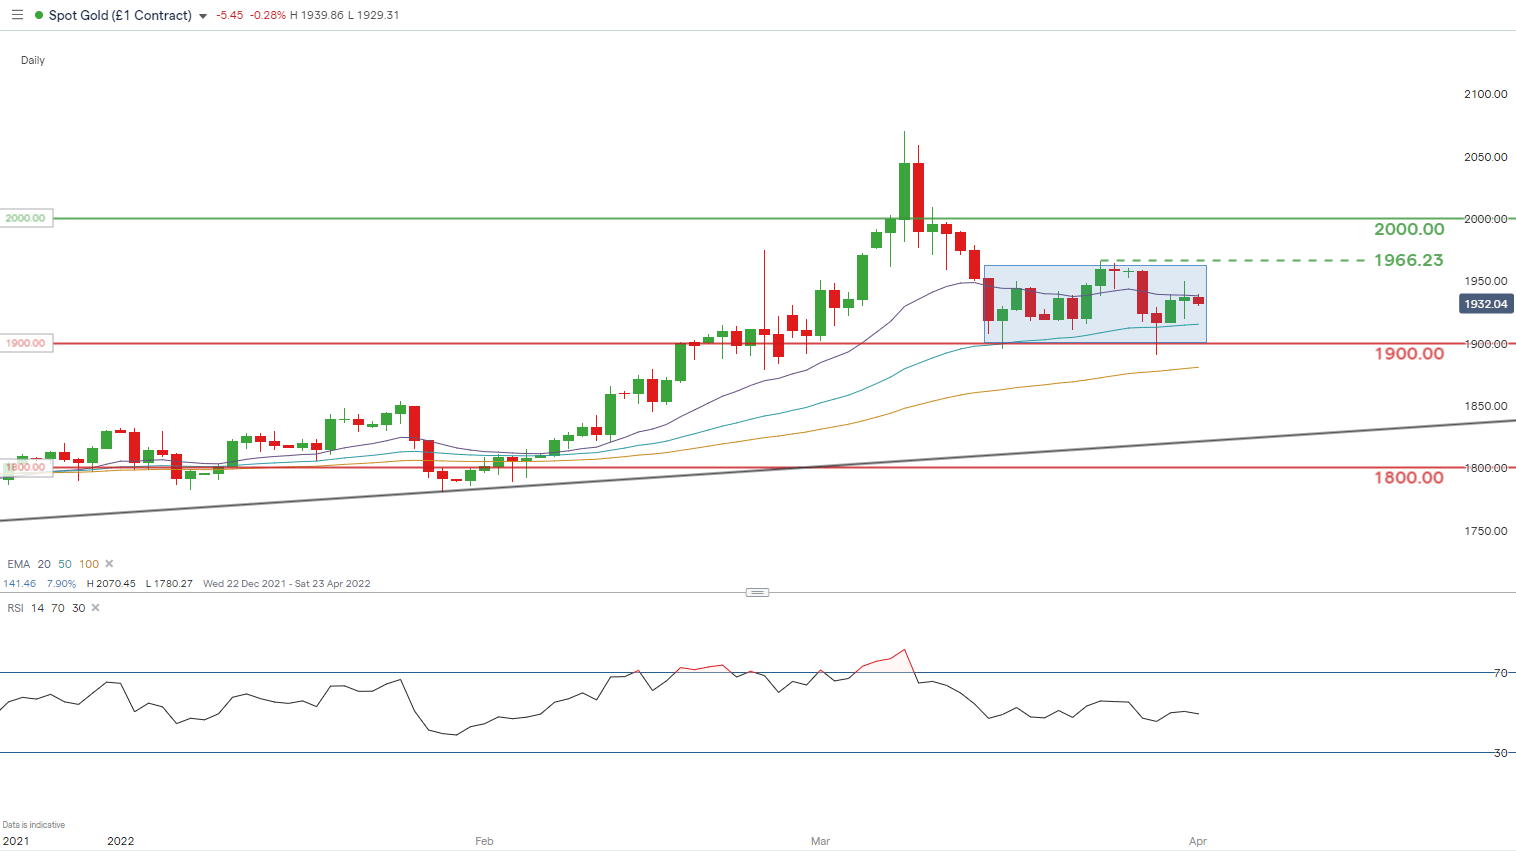
Chart prepared by Warren Venketas, IG
Gold price action continues to trade within a consolidatory rectangle pattern (blue) looking for a breakout. This indecision is reflected by the Relative Strength I ndex (RSI) level currently reading around the midpoint 50 mark favoring neither bullish nor bearish momentum.
Bulls currently find resistance from the 20-day EMA (purple) but a candle close above could spark renewed vigor to subsequent resistance levels.

Resistance levels:
- 2000.00
- 1966.23
- 20-day EMA (purple)
Support levels:
- 50-day EMA (blue)
- 1900.00
BULLISH IG CLIENT SENTIMENT
IGCS shows retail traders are currently distinctly LONG on gold, with 74% of traders currently holding long positions (as of this writing). At DailyFX we typically take a contrarian view to crowd sentiment however, due to recent changes in long and short positioning a short-term upside bias is preferred.
| Change in | Longs | Shorts | OI |
| Daily | 1% | -3% | -1% |
| Weekly | 2% | -8% | -2% |
Contact and follow Warren on Twitter: @WVenketas


