


Dow Jones, Euro, EUR/USD, Gold, Crude Oil, Ukraine, Zaporizhzhia Nuclear Power Station – Market Alert
- Global markets turn risk off amid reports Russia attacked key Ukraine nuclear plant
- Dow Jones futures and Euro drop, gold and crude oil prices rally. USD, JPY gain
- Expect heightened volatility as traders await Western response, NFPs also in focus

During the early hours of Friday’s Asia Pacific trading session, reports crossed the wires that Russia attacked the Zaporizhzhia Nuclear Power Station in Ukraine. It is the largest of its kind in Europe and according to Bloomberg, the Soviet-made 950-megawatt reactors account for about 20% of the nation’s electricity.
Initially, the Nasdaq 100, S&P 500 and Dow Jones futures slid 1.8%, 1.6% and 1.3% respectively. Japan’s Nikkei 225 index fell over 3% as DAX 40 futures were down over 2%. Accompanying the decline in equities around the world was a sliding Euro as well as the sentiment-linked Australian and New Zealand Dollars. Traders were also flocking into the safety of the anti-risk US Dollar and similarly behaving Japanese Yen. Looking at commodities, gold prices were on the rise as WTI crude oil climbed back to the 2013 peak.
Ukraine’s Foreign Minister Dmytro Kulabe, who also reported the attack, said that a fire had broken out at the facility, raising safety concerns. He also noted that firefighters were not able to reach the fire initially. Unconfirmed reports crossed the wires that fire brigades were soon able to access the power plant. President Joe Biden also spoke with Ukraine’s President Zelensky about the event unfolding. The details of the conversation were not available at the time of posting.
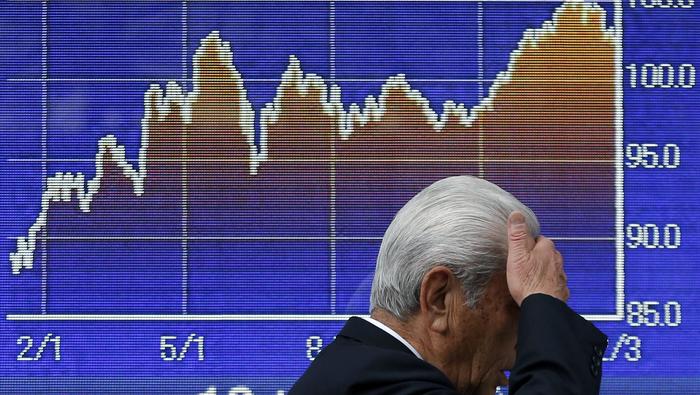
This development followed a rather pessimistic session on Wall Street, where Fed Chair Jerome Powell noted that it was ‘too early to say if Russia changes the rate path’. The rate-sensitive tech sector underperformed the broader market ahead of February’s non-farm payrolls report, due out later today. In addition to the risk of further retaliatory measures from the West, volatility could remain elevated in markets as the weekend nears.
Over an hour after the attack happened, the International Atomic Energy Agency (IAEA) noted that Ukraine reported no change in radiation levels at the plant. This caused markets to trim some of the initial ‘risk-off’ response. It also appeared that no reactors were damaged at the time of posting.

Market Reaction to Russian Shelling of Zaporizhzhia Nuclear Plant
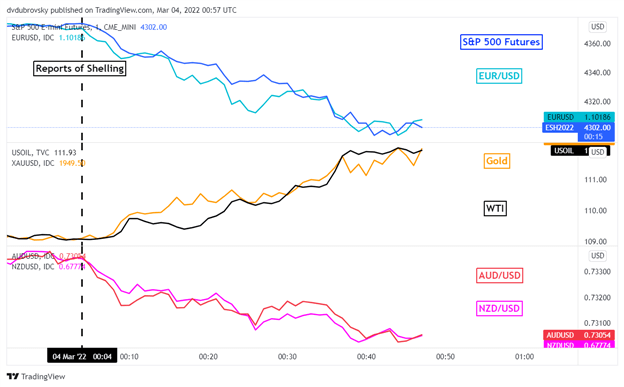
Chart Created Using TradingView
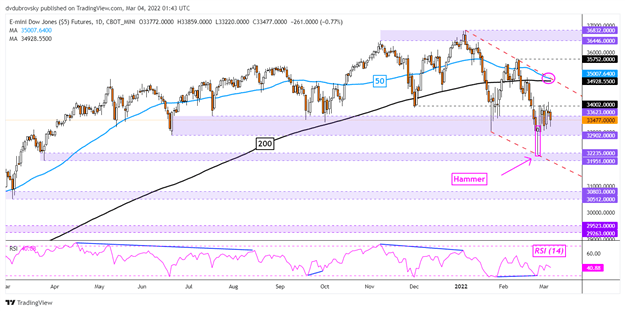
Dow Jones Technical Analysis
On the daily chart, Dow Jones futures continue to consolidate around the key 32902 – 33623 support zone. The index may also be trading within the boundaries of a Falling Wedge chart formation. A recent Hammer candlestick pattern did form, but follow-through has been lacking. Key resistance seems to be the ceiling of the wedge, where a bearish Death Cross may form between the 50- and 200-day Simple Moving Averages.
Dow Jones Futures Daily Chart
Euro Technical Analysis
Looking at EUR/USD, the Euro could be vulnerable to extending losses after prices broke under a Bearish Rectangle chart formation. Immediate support is the 61.8% Fibonacci extension at 1.1048 followed by 78.6% at 1.0927. Beyond that are lows from April 2022, where the 1.0727 – 1.0793 support zone would likely come into play. To the upside, keep a close eye on the 100-day SMA, which may hold as resistance in the event of a turn higher.

EUR/USD Daily Chart
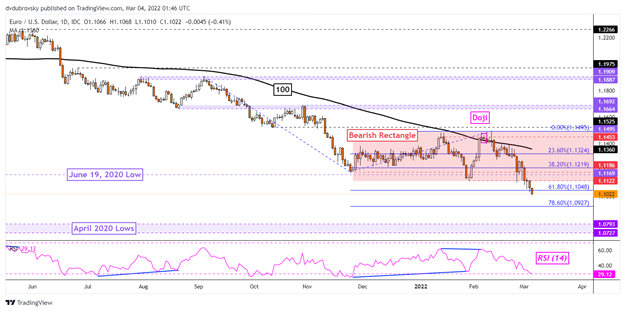
Chart Created Using TradingView
--- Written by Daniel Dubrovsky, Strategist for DailyFX.com
To contact Daniel, use the comments section below or @ddubrovskyFX on Twitter


