


Japanese Yen, US Dollar, NFP Talking Points:
- USD/JPY trades sideways ahead of US employment data (NFP)
- USD price action stalls amid rising geopolitics
- Key technical levels pose as an additional catalyst for price action

Over recent weeks, the safe-haven US Dollar (USD), Japanese Yen (JPY) and Swiss Franc (CHF) have remained resilient against their major counterparts as the war between Russia and Ukraine remains at the forefront of risk-sentiment.
Since September last year, increased pressure on the Federal Reserve to reduce the ballooned balance sheet and to curb rising inflation has supported USD/JPY as the BoJ (Bank of Japan) maintains its dovish stance.
Find out more about the impact of interest rates on the foreign exchange market

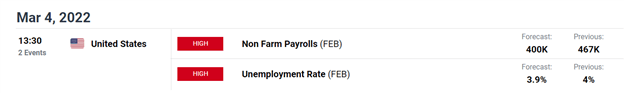
Although the release of the NFP (non-farm payroll) report is considered to be a major risk event, the hawkish rhetoric from Powell and the unprecedented consequences of the war has cast a shadow of doubt over how the Fed aims to tackle inflation in a manner that does not jeopardize the economic recovery.
DailyFX Economic Calendar
USD/JPY Technical Analysis
USD/JPY price action is currently trading in a well-defined range, formed by key Fibonacci levels from historical moves of prominence. Although the upward trajectory has remained intact (Since Sep 2021), a break below the rising wedge allowed bears to temporarily drive prices lower before finding support at around 113.492.
Since then, bulls have managed to drive price action back towards the lower bound of the wedge which is currently holding as resistance at around 116.265.
USD/JPY Weekly Chart

Chart prepared by Tammy Da Costa using TradingView
As prices remain above the 50-day moving average (MA), the CCI (commodity channel index) continues to threaten the upper bound of the range, a potential indication that the pair may be entering into overbought territory.
USD/JPY Daily Chart

Chart prepared by Tammy Da Costa using TradingView
| Change in | Longs | Shorts | OI |
| Daily | -2% | 2% | 0% |
| Weekly | 12% | -16% | -6% |
As bulls aim to regain control of the trend, a break above 116.00 could see prices rising towards the January high (116.639) which then opens the door for a test of the 2017 high (118.667)
However, if bears are able to exert pressure and drive prices lower, a break of 115.000 and increased selling pressure could drive price action back towards 113.00 with the next level of support holding steady at the 112.441 (the 50% retracement of the 2015 – 2016 move).
--- Written by Tammy Da Costa, Analyst for DailyFX.com
Contact and follow Tammy on Twitter: @Tams707


