


Bitcoin, USD Talking Points
- Bitcoin prices remain rangebound as bears drive prices towards trendline support
- BTC/USD tumbles as Russia-Ukraine tensions remain at the forefront of risk sentiment
- Key technical levels continue to provide firm levels of support and resistance
Visit the DailyFX Educational Center to discover how to trade the impact of politics on global markets

Bitcoin prices tumble to support amid heightened geopolitical risks
Bitcoin prices have fallen back below $40,000 as risk sentiment continues to follow developments in the conflict between Russia and the Ukraine.
With investors recently seeking refuge in safe-haven assets, riskier securities and rising volatility has recently weighed on digital assets, preventing BTC/USD to gain traction beyond the $44,000 handle.

Bitcoin (BTC/USD) Technical Analysis
After rising above the upper bound of the falling wedge formation earlier this month, bulls were able to temporarily drive price action above the key psychological level of $44,000 before retreating back towards the 50% Fibonacci retracement level of the 2020 – 2021 move at around $36,540.
As this level continues to provide support for the imminent move, the MACD (moving average convergence/divergence) has crossed on the zero-line while prices remain below both the 10 and 50-period MA (moving average).
Bitcoin Weekly Chart
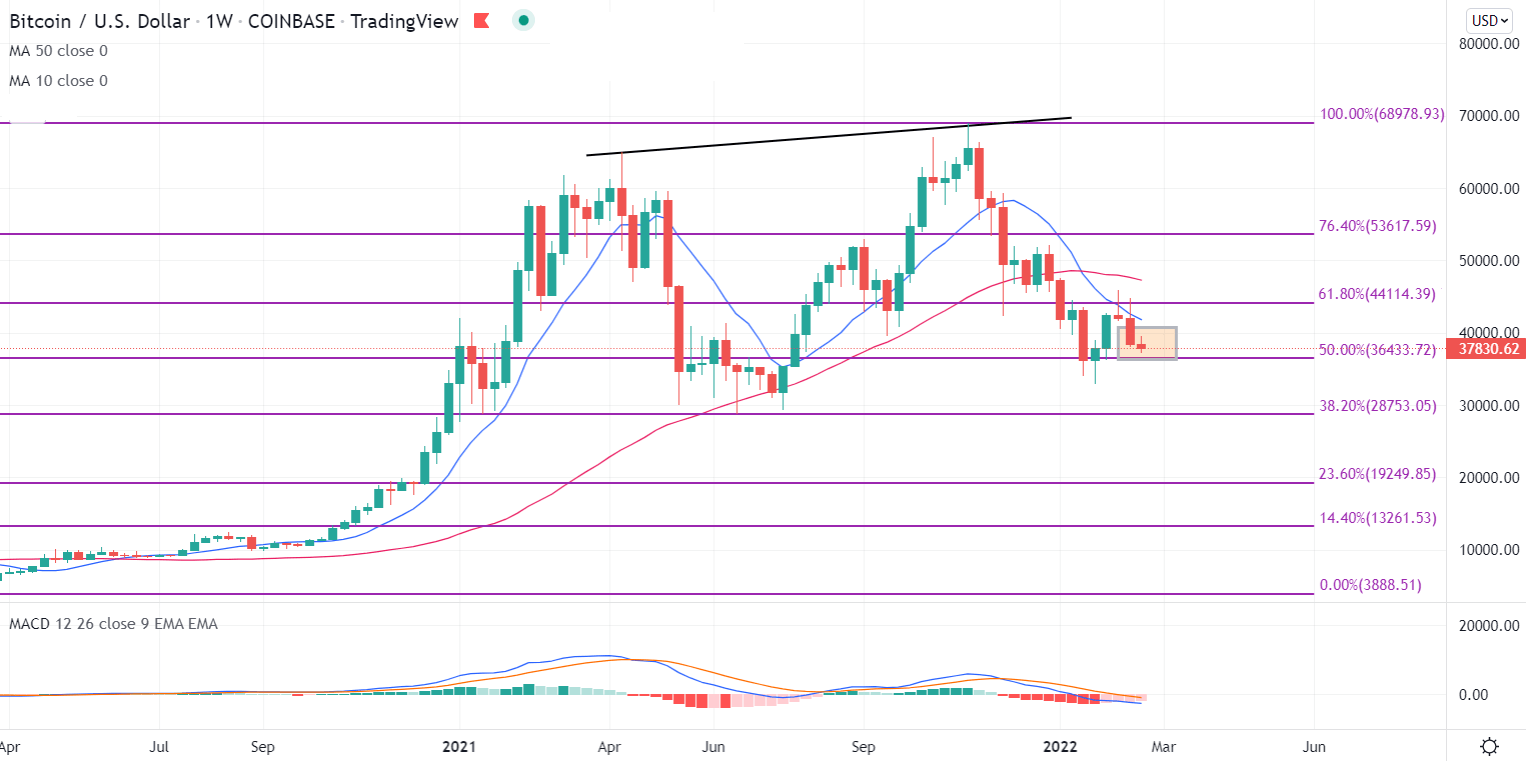
Source: TradingView, Chart by Tammy Da Costa
With the bearish trajectory currently intact, price action remains below both the 10 and 50-day MA (moving average) as bears attempt to drive prices back within the confines of the falling wedge.
Bitcoin Daily Chart
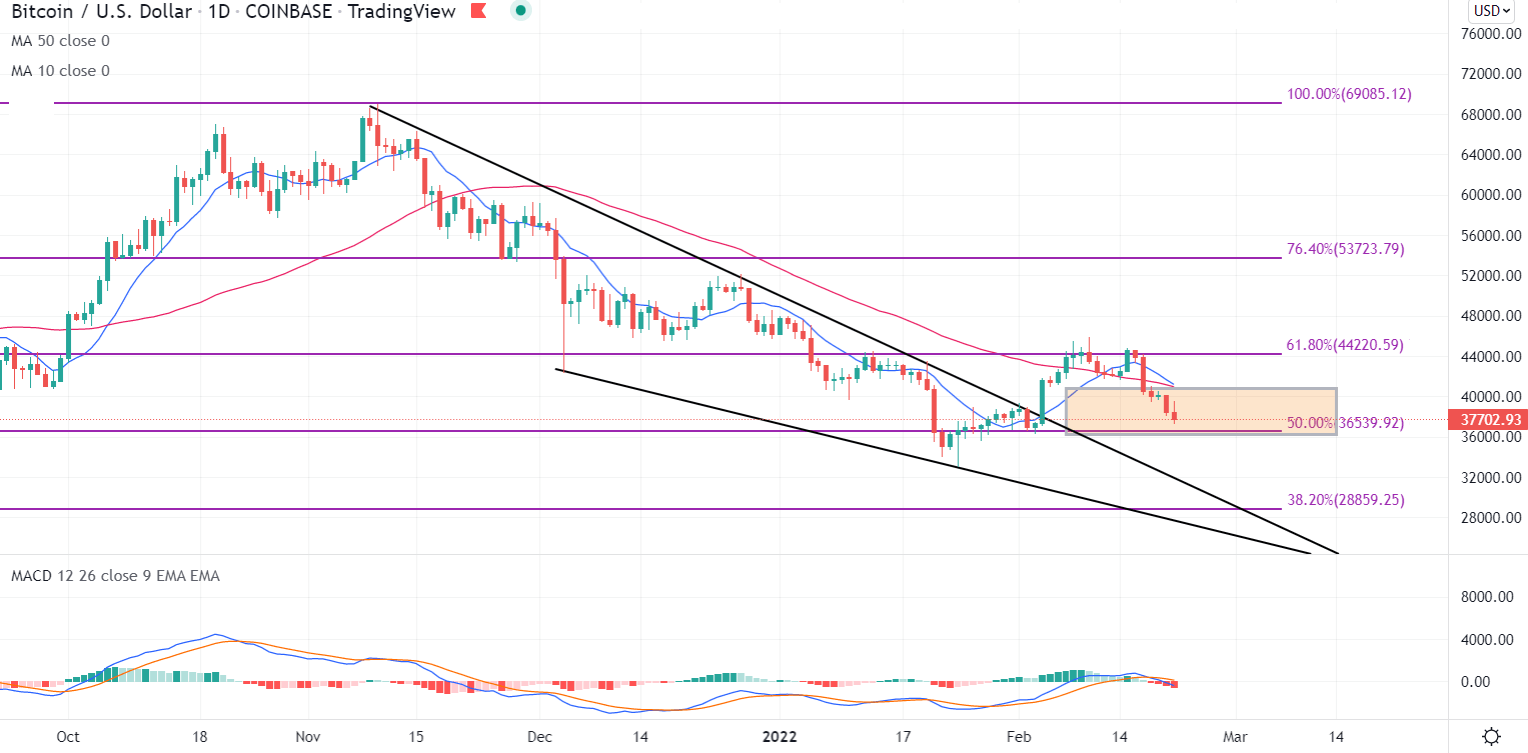
Source: TradingView, Chart by Tammy Da Costa
If selling pressure continues to mount, bearish continuation could result in a retest of the January low ($32,932) which paves the way for the 38.2% retracement of the above-mentioned move at around $28,860.

--- Written by Tammy Da Costa, Analyst for DailyFX.com
Contact and follow Tammy on Twitter: @Tams707


