


GBP/USD Price, Chart, and Analysis
- UK GDP increased by an estimated 7.5% in 2021.
- All eyes on the US dollar after Thursday’s red hot CPI print.

Keep up to date with all market-moving data releases and events by using the DailyFX Calendar

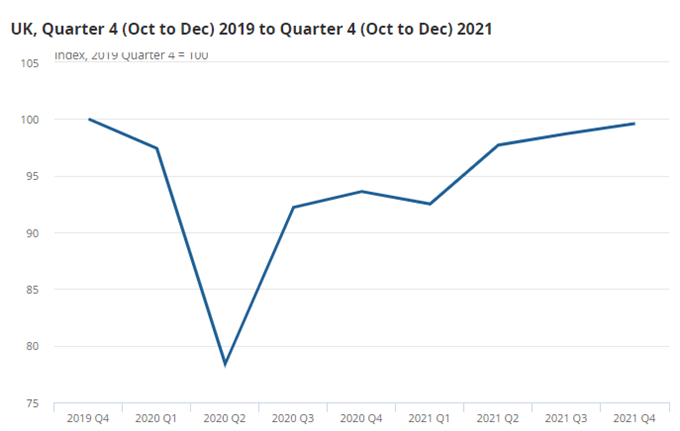
The UK economy grew by 1% in Q4, missing market expectations of 1.1%, according to the latest data from the Office for National Statistics (ONS). UK GDP grew by an estimated 7.5% in 2021, following a 9.4% fall in 2020 the report showed. Monthly estimates show that GDP fell by 0.2% in December but is at its pre-coronavirus level (February 2020).
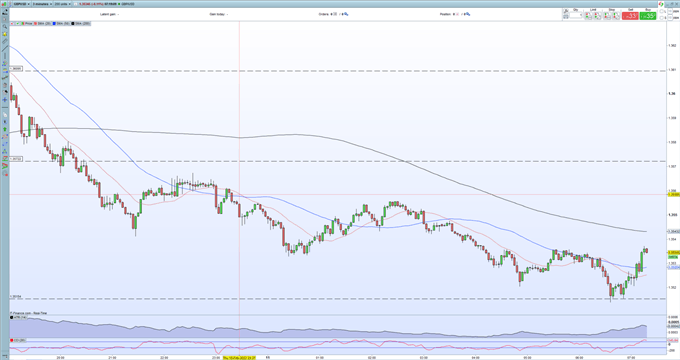
GBP/USD nudged higher post-release with cable trading around 1.3535. GBP/USD traded as high as 1.3645 on Thursday before the latest US CPI release showed US inflation running at a red hot level of 7.5%, prompting market expectations of up to seven 25 basis point rate hikes this year. There is even mounting talk of a 50 basis point hike at the March meeting and the faint possibility of an intermeeting hike soon.
Trade Smarter - Sign up for the DailyFX Newsletter
Receive timely and compelling market commentary from the DailyFX team
GBP/USD 3 Minute Price Chart – February 11, 2022
Retail trader data show 52.76% of traders are net-long with the ratio of traders long to short at 1.12 to 1. The number of traders net-long is 12.54% lower than yesterday and 5.40% lower from last week, while the number of traders net-short is 5.52% lower than yesterday and 11.65% lower from last week.
We typically take a contrarian view to crowd sentiment, and the fact traders are net-long suggests GBP/USD prices may continue to fall. Positning is less net-long than yesterday but more net-long from last week. The combination of current sentiment and recent changes gives us a further mixed GBP/USD trading bias.
| Change in | Longs | Shorts | OI |
| Daily | 3% | -7% | -3% |
| Weekly | 4% | -10% | -5% |
What is your view on GBP/USD – bullish or bearish?? You can let us know via the form at the end of this piece or you can contact the author via Twitter @nickcawley1.


