


GBP/USD Price, Chart, and Analysis
- The Bank of England now has a problem, to hike or not to hike?
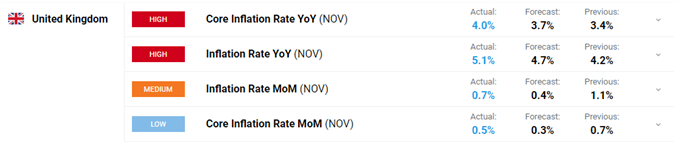
- Inflation soars across the board.

Keep up to date with all market-moving data releases and events by using the DailyFX Calendar
The latest UK inflation data will be a stark reminder to the Bank of England that price pressures are getting out of control and that interest rate hikes are needed, and quickly. Headline UK inflation hit a decade high 5.1% in November, beating forecasts of 4.7% and a prior month’s reading of 4.2%
These levels of inflation would normally prompt a response from the BoE, especially when taken alongside another set of robust employment figures released yesterday. However, the central bank may put off hiking rates at tomorrow’s policy meeting with the rapid spread of Omicron now seemingly dictating monetary policy. The BoE is now stuck between a rock and a hard place.
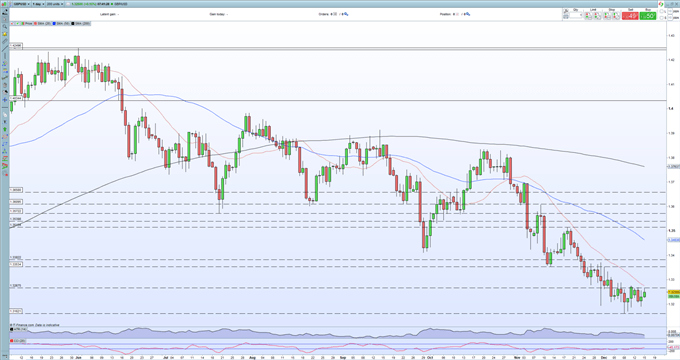
GBP/USD has nudged higher post-release but remains in a longer-term downtrend off the June 1.4250 high. Support at 1.3162 has held. Cable traders are now facing two high-impact events over the next day, tonight’s FOMC meeting and tomorrow’s BoE meeting, both of which could move cable sharply.
GBP/USD Daily Price Chart December 15, 2021
Retail trader data show 72.18% of traders are net-long with the ratio of traders long to short at 2.59 to 1. The number of traders net-long is 5.50% lower than yesterday and 2.44% lower from last week, while the number of traders net-short is 15.33% higher than yesterday and 15.33% higher from last week.
We typically take a contrarian view to crowd sentiment, and the fact traders are net-long suggests GBP/USD prices may continue to fall. Yet traders are less net-long than yesterday and compared with last week. Recent changes in sentiment warn that the current GBP/USD price trend may soon reverse higher despite the fact traders remain net-long.
| Change in | Longs | Shorts | OI |
| Daily | 3% | -7% | -3% |
| Weekly | 4% | -10% | -5% |
What is your view on GBP/USD – bullish or bearish?? You can let us know via the form at the end of this piece or you can contact the author via Twitter @nickcawley1.


