


Dow Jones, Nikkei 225, ASX 200, Fed – Asia Pacific Indices Briefing
- Dow Jones, S&P 500 and Nasdaq 100 drop to start off the new week
- Markets may be nervous ahead of the Federal Reserve rate decision
- The Nikkei 225 & ASX 200 could be looking at a disappointing Tuesday

Monday’s Wall Street Trading Session Recap
Sentiment deteriorated to start off the new week on Wall Street. Futures tracking the Dow Jones, S&P 500 and Nasdaq 100 declined 0.93%, 0.94% and 1.53% respectively. While the VIX market ‘fear gauge’ climbed by 8.61%, the index remains in a near-term downtrend since earlier this month. Today’s risk aversion could be the market’s pricing in a busy week before data winds down ahead of the New Year.
Four central banks from developed economies will be releasing their year-end monetary policy announcements. There will likely be a particular focus on the Federal Reserve on Wednesday after headline inflation rocketed to a near 40-year high at the end of last week. This could be leading to markets anticipating a more hawkish Fed in 2022.
One outcome that is gaining attention is a chance that the central bank could speed up tapering asset purchases as it winds down post-Covid quantitative easing. Lately, periods of balance sheet growth slowdown have been associated with disappointing returns on Wall Street. With the S&P 500 still around an all-time high, traders may be reluctant to commit to a direction before key event risks pass.
Dow Jones Technical Analysis
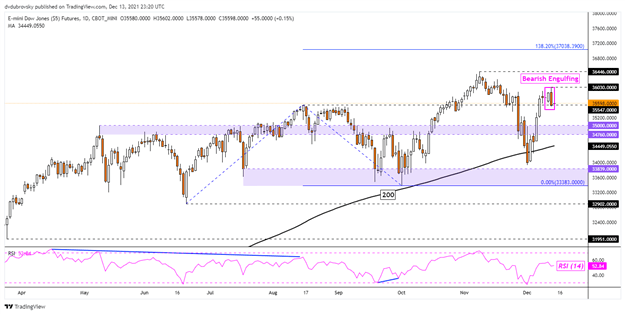
Dow Jones futures left behind a Bearish Engulfing candlestick pattern on the daily chart below. While this can be a sign of a reversal coming, confirmation is key to see if there could be follow-through. Immediate support seems to be the 35547 inflection point. Below that is the 200-day Simple Moving Average, which could reinstate the broader uptrend. Key resistance seems to be the all-time high at 36446.
Introduction to Technical Analysis
Candlestick Patterns
Recommended by Daniel Dubrovsky
Dow Jones Daily Chart
Tuesday’s Asia Pacific Trading Session
Following the rather disappointing session on Wall Street, Asia-Pacific markets could be looking at a similar fate on Tuesday. The economic docket is fairly light. Australian business confidence and Japanese industrial production are due for the ASX 200 and Nikkei 225 respectively. These may do little to influence respective monetary policy expectations, placing the focus for equities on broader market mood.
Trading Strategies and Risk Management
Global Macro
Recommended by Daniel Dubrovsky
Nikkei 225 Technical Analysis
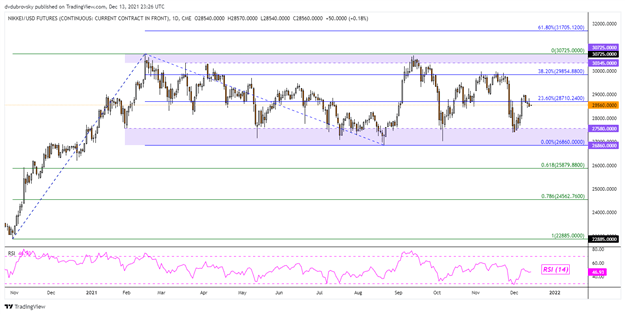
Japan’s Nikkei 225 remains in a consolidative state, struggling to find material direction since the beginning of this year. The index is ranging between a zone of support (26860 – 27580) and a range of resistance (30725 – 30345). Recently, prices have been struggling to push above the 23.6% Fibonacci extension at 28710. Its rejection could pave the way for a retest of the support zone.
Nikkei 225 – Daily Chart
ASX 200 Technical Analysis
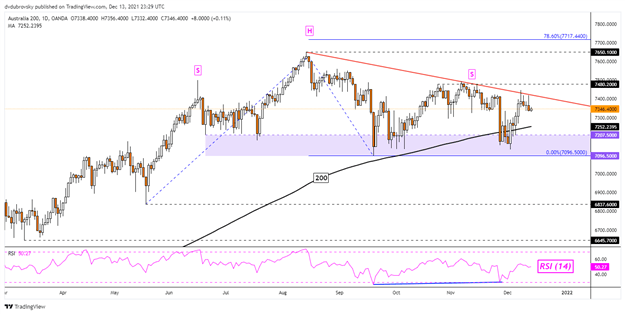
The ASX 200 also remains in a fairly congestive state, with prices trading around levels seen back in late May. A bearish Head and Shoulders chart formation still remains in play. Prices recently rejected the right shoulder, where resistance sits around 7480. This could lead to a retest of the neckline, which seems to be a range between 7096 – 7207.
ASX 200 – Daily Chart
--- Written by Daniel Dubrovsky, Strategist for DailyFX.com
To contact Daniel, use the comments section below or @ddubrovskyFX on Twitter
Trade Smarter - Sign up for the DailyFX Newsletter
Receive timely and compelling market commentary from the DailyFX team


