


GOLD ANALYSIS
- Hawkish Powell weighs down on bullion.
- Symmetrical triangle break.
- IG client sentiment supports further downside.
BULLION FUNDAMENTAL BACKDROP
Cold water has been poured over spot gold prices since mid-November with more recent comments by Fed Chair Powell adding additional impetus to the downside move. The hawkish bias (potential for quicker tapering and tightening) now associated with the Fed, does not favour the yellow metal because a less accommodative approach favors higher U.S. Treasury yields and a stronger dollar. Both weigh negatively on gold prices with the U.S. dollar inversely correlated while rising Treasuries increase the opportunity cost .
Markets have sent real yields higher (increasing the opportunity cost of holding gold) after Fed Chair Powell’s comments on the Fed’s willingness to combat inflationary pressures.
TREASURY REAL YIELD CURVE RATES 5,10-YEAR:
Source: Nasdaq Data Link
Gold’s safe-haven appeal is still worthwhile mentioning as long as Omicron uncertainties remain. Thus far, transmissibility is high but there is no evidence of severe morbidity. I believe the current blurred outlook is helping to buoy gold prices.
Furthermore, OPEC+ has decided to maintain it’s output increase in January 2022 causing crude oil prices to drop. Traditionally, lower crude oil prices points to less inflationary pressure and thus reduced support for higher gold prices.
GOLD ECONOMIC CALENDAR

Look out for the NFP print tomorrow. A positive number will add to the hawkish tilt currently filtering through markets and could see gold moving lower.
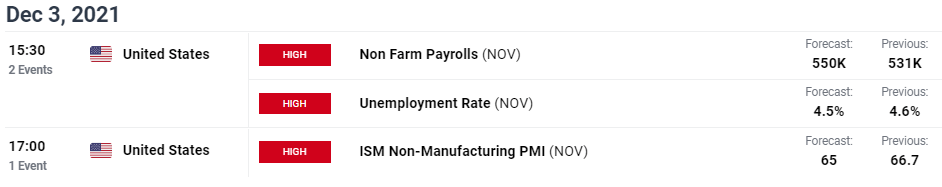
Source: DailyFX economic calendar
TECHNICAL ANALYSIS
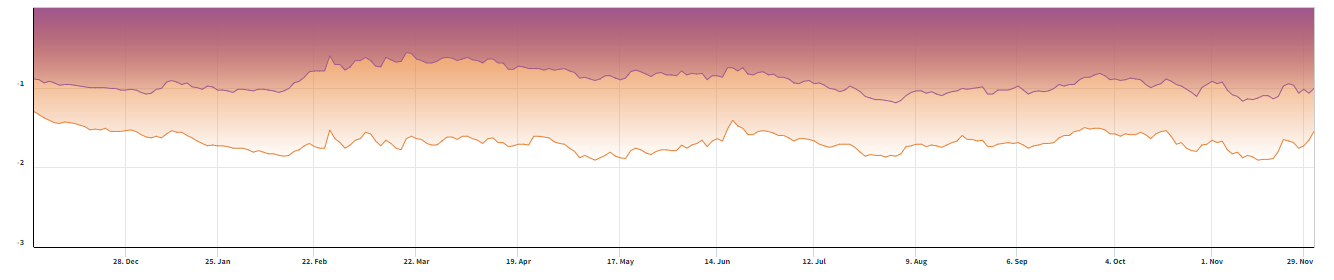
GOLD PRICE DAILY CHART

Chart prepared by Warren Venketas, IG
Spot gold has broken below symmetrical triangle (black) resistance and has subsequently confirmed the push lower via daily candle closes. The EMA may also reflect a bearish signal should the 20-day EMA (purple) cross below the 50-day EMA (blue).
The 1775.00 area of confluence has recently held as firm support and a break below could spark significant downside to subsequent support levels.

Resistance levels:
- 1813.32
- 1800.00
Support levels:
- 1775.00
- 1758.89
IG CLIENT SENTIMENT DATA SUPPORTIVE OF DOWNSIDE BIAS
IGCS shows retail traders are currently distinctly short on spotgold, with 80% of traders currently holding long positions (as of this writing). At DailyFX we typically take a contrarian view to crowd sentiment and the fact traders are net-long is suggestive of a short-term bearish inclination.
| Change in | Longs | Shorts | OI |
| Daily | 1% | -3% | -1% |
| Weekly | 2% | -8% | -2% |
Contact and follow Warren on Twitter: @WVenketas


