


US Dollar Price, Chart, and Analysis
Keep up to date with all market-moving data releases, events, and speeches by using the DailyFX Calendar

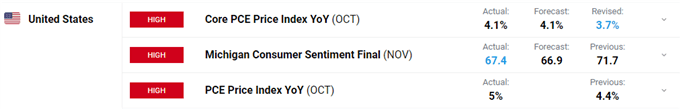
The latest FOMC minutes, released last night, show that the Fed remains cautious over growth and ongoing price pressures. In yesterday’s statement, the staff outlook judged that ‘the risks to the baseline projection for economic activity were skewed to the downside and that the risks around the inflation projection were skewed to the upside’. Core personal consumption rose by 4.1% in October on a year-on-year basis, data revealed yesterday, while the PCE Price Index rose by 5% over the same time frame. These figures, the Fed’s favored measure of price pressures, will add to calls for the US central bank to rein in its bond-buying program at an increased pace and force the Fed to raise interest rates sooner than originally expected.

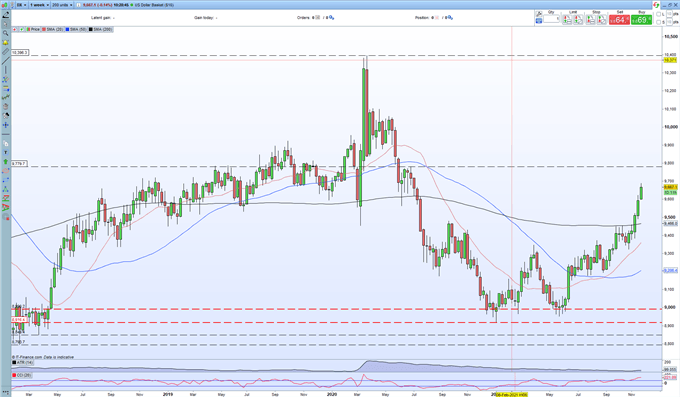
The annual Thanksgiving Day holiday in the US today, coupled with shortened trading hours on Friday, is expected to pare any movement in the greenback until markets re-open next Monday. The dollar remains just off its best levels in 16-months and the daily chart suggests that further gains are likely in the weeks ahead. The weekly chart shows an unbroken five-week run of gains and a series of higher highs and higher lows since the start of the year. The 200-day average was eventually broken, and with ease, a couple of weeks ago after capping gains between the end of September and the start of November. The next level of resistance is likely around the 97.80 level.
US Dollar (DXY) Weekly Price Chart November 25, 2021

What is your view on the US Dollar – bullish or bearish?? You can let us know via the form at the end of this piece or you can contact the author via Twitter @nickcawley1.


