


Nasdaq 100, Dow Jones, Nikkei 225, Powell Renomination, Treasuries – Asia Pacific Indices Briefing
- Nasdaq 100 sinks as Dow Jones outperforms after Jerome Powell renomination
- Key moving averages for the Nasdaq remain in play, upholding current uptrend
- Nikkei 225 may fall after Wall Street volatility, broader outlook remains neutral

Monday’s Wall Street Trading Session Recap
Volatility struck Wall Street to begin the new trading week, with the tech-heavy Nasdaq 100 sinking about 1.2%. This is as the cyclically-sensitive Dow Jones outperformed slightly, with futures rising 0.06%. Meanwhile, S&P 500 futures declined 0.31%. The VIX index, also known as the market’s preferred ‘fear gauge’, closed at its highest since October 13th after rallying 7.04%.
The focus today was on US President Joe Biden’s Federal Reserve Chair pick, where he renominated current chief Jerome Powell for a second term. Leading into the event, the odds of a Lael Brainard pick were rising, creating uncertainty. She was nominated as the vice chair. The passing event risk meant that markets could focus on a key fundamental theme, rising hawkish monetary policy expectations for 2022.
Last Friday, Federal Reserve Governors Christopher Waller and Richard Clarida noted that the central bank ‘may need’ to increase the pace of quantitative easing tapering. Treasury yields rose across the board on Monday, and odds of a third rate hike by the end of next year climbed. This left growth-oriented stocks, particularly tech, vulnerable. Financial and energy stocks outperformed.
Nasdaq 100 Technical Analysis
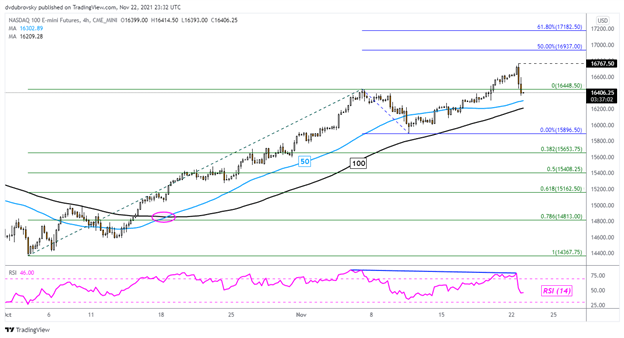
Zooming in on the 4-hour chart, the Nasdaq 100’s decline still left it short of the 50-period Simple Moving Average (SMA). As such, the near-term uptrend since early October still remains intact. Recent declines do follow negative RSI divergence, which is often a sign of underlying weakness. Further losses that take out the 50- and 100-period SMAs could hint at a broader reversal, exposing the November 10th low at 15896. Otherwise, uptrend resumption entails a push above 16767.
Introduction to Technical Analysis
Candlestick Patterns
Recommended by Daniel Dubrovsky
Nasdaq 100 – Daily Chart
Tuesday’s Asia Pacific Trading Session
Tuesday’s Asia-Pacific trading session is lacking notable economic event risk, leaving traders vulnerable to general risk appetite. Given the deterioration in sentiment on Wall Street, this is leaving APAC indices at risk of a broadly disappointing session. The holiday-shortened week in the United States, due to Thanksgiving, could make for illiquid trading conditions, exacerbating volatility.
Trading Strategies and Risk Management
Global Macro
Recommended by Daniel Dubrovsky
Nikkei 225 Technical Analysis
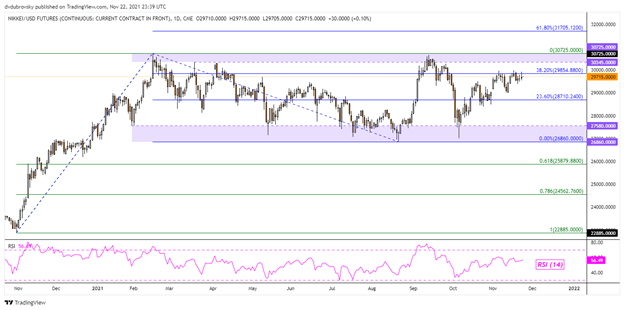
The Nikkei 225, Japan’s benchmark stock index, has been in a short-term uptrend since October. However. prices remain in a broadly consolidative state since the beginning of this year. Immediate resistance seems to be the 38.2% Fibonacci extension at 29854. Clearing this price exposes the well-defined 30345 – 30725 resistance zone. Otherwise, a turn lower may open the door to retesting the 23.6% extension at 28710.
Nikkei 225 – Daily Chart
--- Written by Daniel Dubrovsky, Strategist for DailyFX.com
To contact Daniel, use the comments section below or @ddubrovskyFX on Twitter
Trade Smarter - Sign up for the DailyFX Newsletter
Receive timely and compelling market commentary from the DailyFX team


