


Dow Jones, Crude Oil, Energy Stocks, Corporate Taxes, Nikkei 225, US CPI, Technical Analysis – Asia Pacific Indices Briefing
- Dow Jones gains with energy stocks as monthly OPEC report boosts crude oil prices
- Nasdaq 100 falls as Democrats release updated Biden tax plan, eyes on corporate rate
- Nikkei 225 may follow mostly rosy Wall Street lead before US CPI data later in the day
Trade Smarter - Sign up for the DailyFX Newsletter
Receive timely and compelling market commentary from the DailyFX team
Monday’s Wall Street Trading Session Recap
The Dow Jones outperformed the S&P 500 and Nasdaq 100 to start off the new trading week, with the indices closing +0.76%, +0.23% and -0.03% respectively. A rise in energy stocks propelled the relatively cyclically-sensitive Dow Jones. As a sector within the S&P 500, energy shares were the best, gaining almost 3%. The health care sector was the worst, sinking 0.61%.
A 1.48% rise in WTI crude oil prices, which closed at the highest since early August, likely benefited energy stocks. Earlier in the day, OPEC released its monthly oil outlook report. The group increased the forecast for OPEC crude consumption by 260k barrels per day for 2021. This follows supply disruptions outside of the oil-producing cartel.
Meanwhile, tech stocks took a hit as the Democrats released an updated US tax plan which would increase the top corporate tax rate to 26.5% from 21% currently. The proposal also increases the top capital gains tax rate to 25% from 20%. Investors may have dumped those assets that they deemed to be the most overvalued in relative terms in anticipation of the potential hit to company profits that these tax changes might imply.
Dow Jones Technical Analysis
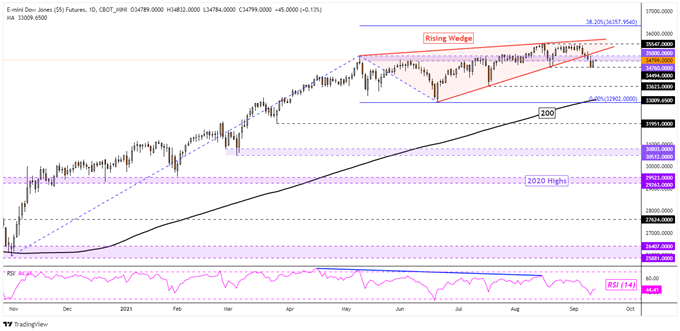
The rise in the Dow Jones on Monday reversed some of the recent losses seen after completion of a bearish Rising Wedge chart pattern on the daily chart below. This likely reinforced the key 34494 support point, which is the August low. A further upside close from here could open the door to retesting the wedge floor. Otherwise, closing under 34494 would expose the 200-day Simple Moving Average.
Introduction to Technical Analysis
Candlestick Patterns
Recommended by Daniel Dubrovsky
Dow Jones Futures – Daily Chart
Tuesday’s Asia Pacific Trading Session
Futures tracking equities on Wall Street are pointing cautiously higher heading into Tuesday’s Asia-Pacific trading session. This could set a rosy tone for general market sentiment. Aside from a speech from Reserve Bank of Australia Governor Philip Lowe, the economic docket is fairly quiet. Markets may mark time until the highly-anticipated US CPI report crosses the wires during Tuesday’s US session. A higher-than-anticipated outcome may bring forward Fed tapering bets, inducing market volatility.
Trading Strategies and Risk Management
Global Macro
Recommended by Daniel Dubrovsky
Nikkei 225 Technical Analysis
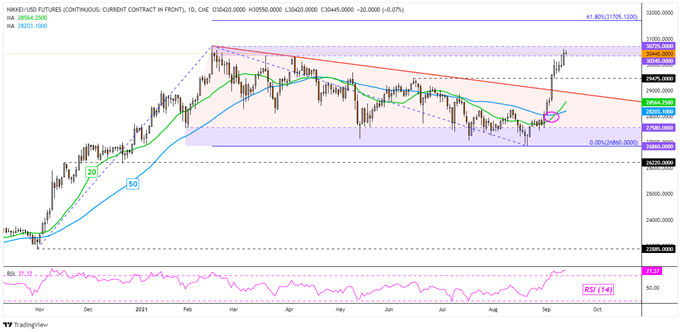
Nikkei 225 futures may be heading for another record-high close, but prices could still be constrained within key resistance between 30345 and 30725. This zone contains the upper wick that was left behind on February 16th. A bullish crossover between the 20- and 50-day Simple Moving Averages (SMAs) offers a near-term upside technical bias.
Nikkei 225 Futures – Daily Chart
--- Written by Daniel Dubrovsky, Strategist for DailyFX.com
To contact Daniel, use the comments section below or @ddubrovskyFX on Twitter


