


Key Talking Points:

Stocks made a decisive move lower last week which started to set the stage for a wider correction but the move so far this week seems to be rejecting further pullbacks. The moves last week coincided with warnings from major banks about the limited performance of stocks in the coming years, as well as downgrades to their forecasts for US GDP after the recent slump in jobs reports and rising delta cases worldwide.
That said, there are very few signs of investor fear and so we are likely to continue seeing bears struggle to make way. The end of September/beginning of October is usually seasonally weak for the stock market so but I still think there needs to be increased pessimism to make a significant break lower. There isn’t much on the calendar for today to make a significant impact on trading direction and so we could see equities drift higher throughout the session, but investors will likely be keeping an eye out for US inflation data on Tuesday to make sure that prices are still moving in line with their predictions to keep the Fed focused on tapering asset purchases throughout year-end.
DAX 30 Daily Chart
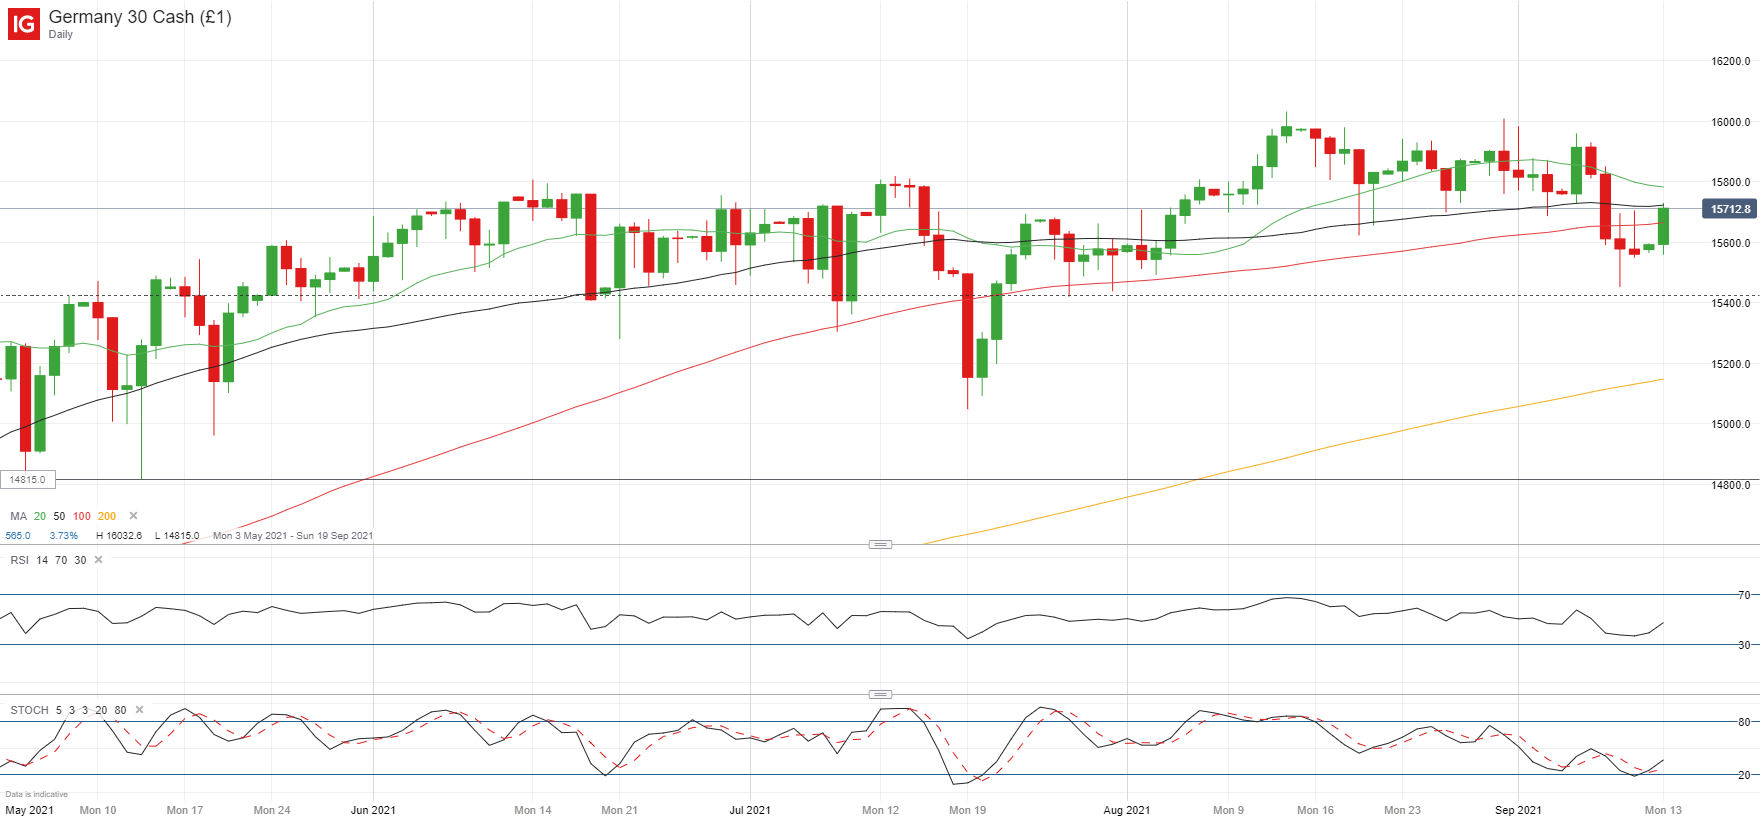
The DAX 30 is leading the gains in Europe this morning after last weeks’ pullback found support within close range of the 127.2% Fibonacci extension (15,424), which has been the main barrier for bears for the last few months. The move higher this morning is starting o find some short-term resistance at the 50-day SMA (15,720) and so we may see gains caped for the rest of the session. If so, I would expect small moves within the daily candlestick (15,558 and 15,730) with a lack of conviction to break lower. On the upside, the area between 15,730 and 15,800 may be tougher for bulls to crack.
S&P 500 Daily Chart
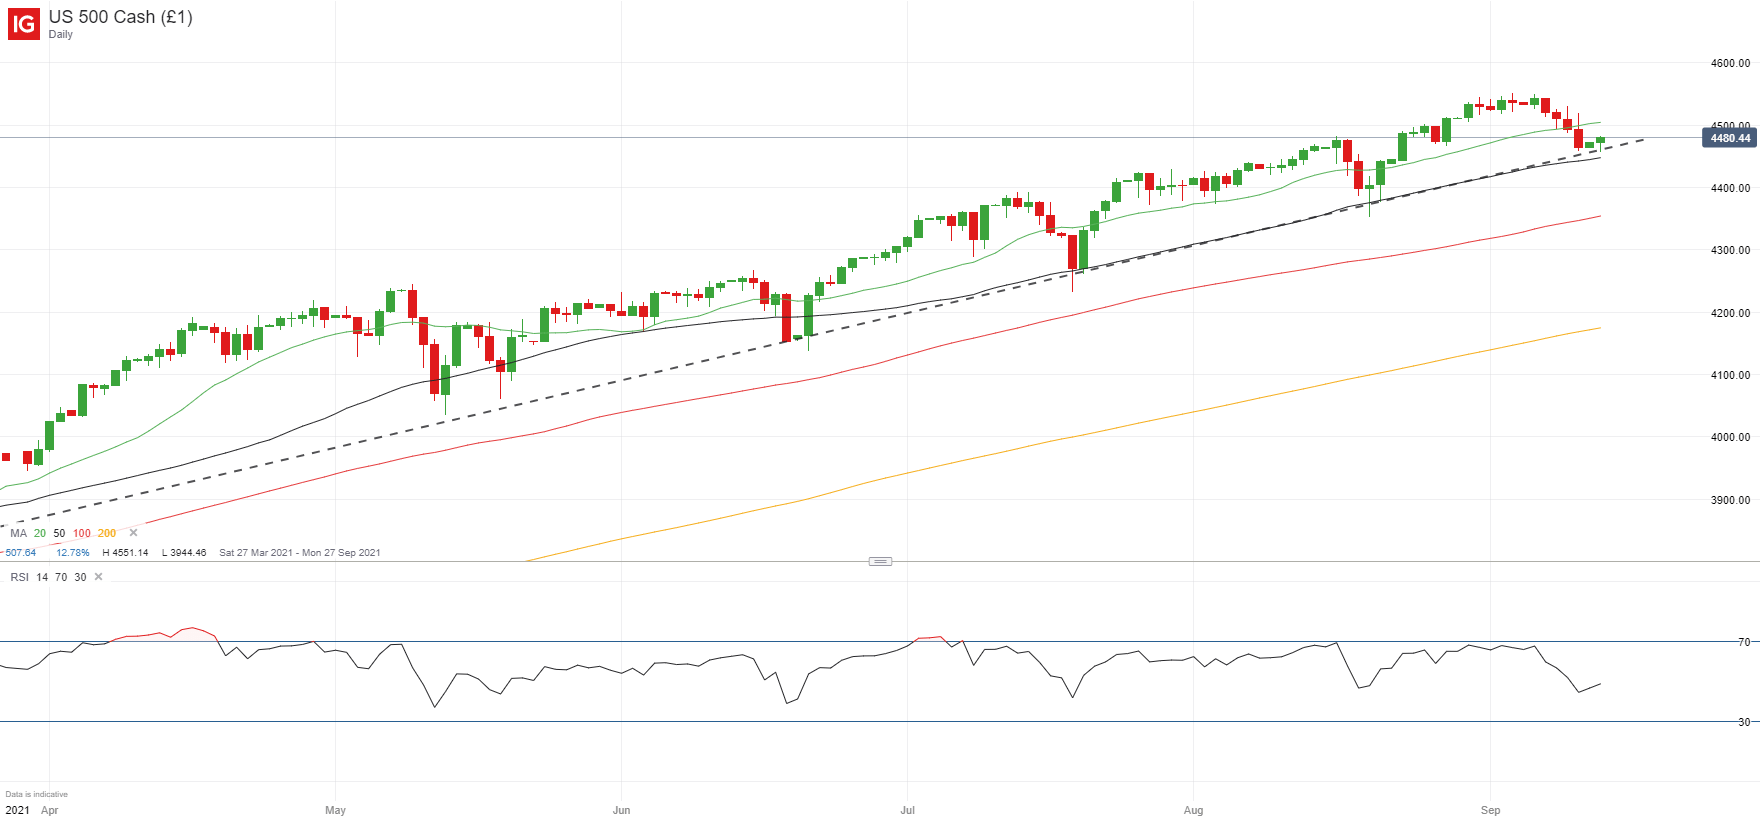
The S&P 500 has been following a strict pattern for the last year and last week’s move lower fell in nicely with its pattern. The ascending trendline connecting the higher lows has once again offered the key support needed to reverse the selling pressure and the index is once again turning higher. One thing to note is that the width of the arch is tightening with each bounce off the trendline support and so this is likely a sign that momentum is picking up and we may see a significant break lower at some point. For now, I would expect buyers to continue pushing higher above 4,500 with a target over the next few weeks at 4,600.
| Change in | Longs | Shorts | OI |
| Daily | -9% | 7% | 2% |
| Weekly | -27% | 9% | -5% |
Learn more about the stock market basics here or download our free trading guides.
--- Written by Daniela Sabin Hathorn, Market Analyst
Follow Daniela on Twitter @HathornSabin


