
Natural Gas Talking Points
- Hurricane Ida shutdown the vast majority of natural gas production in the United States prior to making landfall, helping charge a 12%, 2-day rally through Friday
- After a bullish gap on the open Monday, the commodity traded as much as -7% off its intraday highs
- Monday’s high has pushed levels for the market not seen since December 2018 – a prominent reversal threat – but a long-term break above 4.000 may have shifted the long-term balance

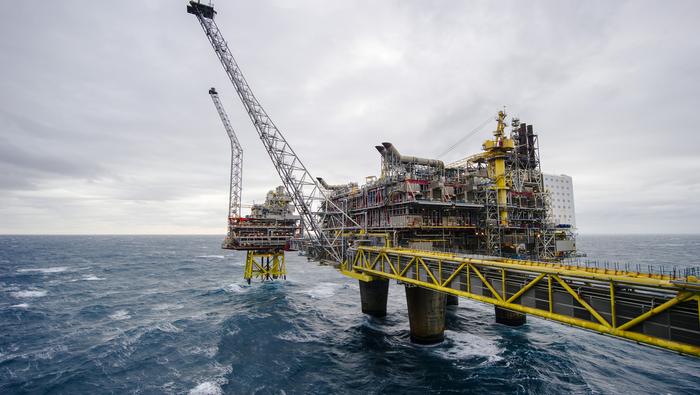
Hurricane Ida’s drive through the Gulf of Mexico caused havoc for key energy production hubs heading into the weekend and drove regional pricing of key commodities higher. Yet, with the storm moving in-land and its wind speeds diminishing, the supply-side constraints driving up prices like those from natural gas look as if they will ease. Leading into the storm’s landfall as a Category 4 Hurricane on the Louisiana coast late Sunday into Monday, approximately 95 percent of US oil and gas production (in particular 93.8 percent of natural gas alone) in the Gulf Coast region was closed. Naturally, this clamp on supply would drive market prices sharply higher into the weekend and through electronic trading early Monday morning. Pushing as high as 4.526, natural gas has reached highs not seen since back in early December 2018 and on high volume.
Chart of the Natural Gas Futures with 50-Day SMA, Volume and Rate of Change (Daily)
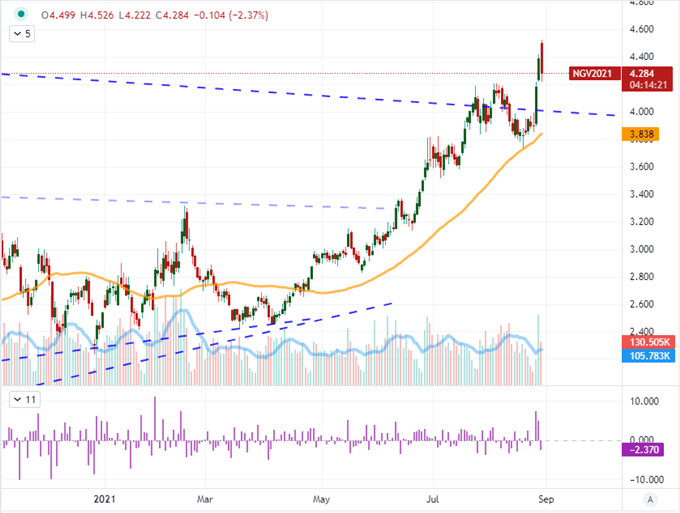
Chart Created on Tradingview Platform
The tempo of trading was remarkable Friday with nearly 211,000 contracts turned over in the active nearby – the heaviest trading day in six months. By the morning session Monday, the market looked as if it was on pace to match of outstrip that run. Given the incredible build up and subsequent rebalance on a seasonal distortion, it would not be surprising to see volume in the same category during a correction. The question is how far a retracement may go. The commodity was showing a retreat through active trade after another strong gap on the Friday to Monday open (as the storm had not fully moved into land by that point). Yet, as production comes back online and traders weigh the lingering backdrop of concerns around demand as covid concerns raises economic pace concerns, maintaining the bullish charge through a historically quiet period like this week may prove difficult.
Chart of the Natural Gas Futures with 50-Day SMA and Daily Gaps (Daily)
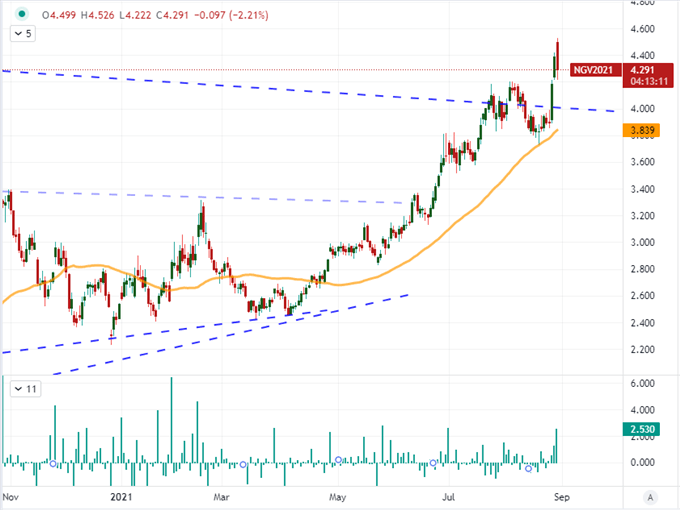
Chart Created on Tradingview Platform
However, shifting from a time frame that considers only this week’s scope to something of a longer duration, the technical considerations present a very interesting counterpart. When the markets made their push through the 4.000-mark this past month, it put serious pressure on a descending triangle pattern that can only be seen on the monthly chart as its resistance stretches back to 2008. There are plenty of technical points above to cause problems should we continue to advance, but they are at generous distance: the 5.000 high set back in 2018; the 6.500 high from February 2014 and the 38.2% Fib of the past two decades’ range at 7.000. That said, a five-month charge on a key resistance break will raise the debate with fundamental demand forecasts that will inevitably follow.
Chart of Natural Gas Futures with Volume (Monthly)
Chart Created on Tradingview Platform