


Euro (EUR/USD)Price, Chart, and Analysis
- Strong Euro Zone growth and inflation data helped underpin recent Euro strength.
- Retail traders cut back long positions, increase net-shorts.

The Euro Zone economy expanded by 2.0% in the first look at Q2 q/q data, beating analysts’ expectations of a 1.5% increase. Among member states Portugal (4.9%) recorded the highest increase, followed by Austria (4.3%) and Latvia (3.7%). The block’s largest member state Germany grew by 1.5%, missing forecasters’ expectations of a 2.0% rise.
Euro area annual inflation rose by 2.2%, up from 1.9% in June, boosted by a 14.1% rise in energy prices, while food, alcohol and tobacco prices rose by 1.6%. The Euro area unemployment rate fell to 7.7%.

For all market-moving economic data and events, see the DailyFX Calendar.
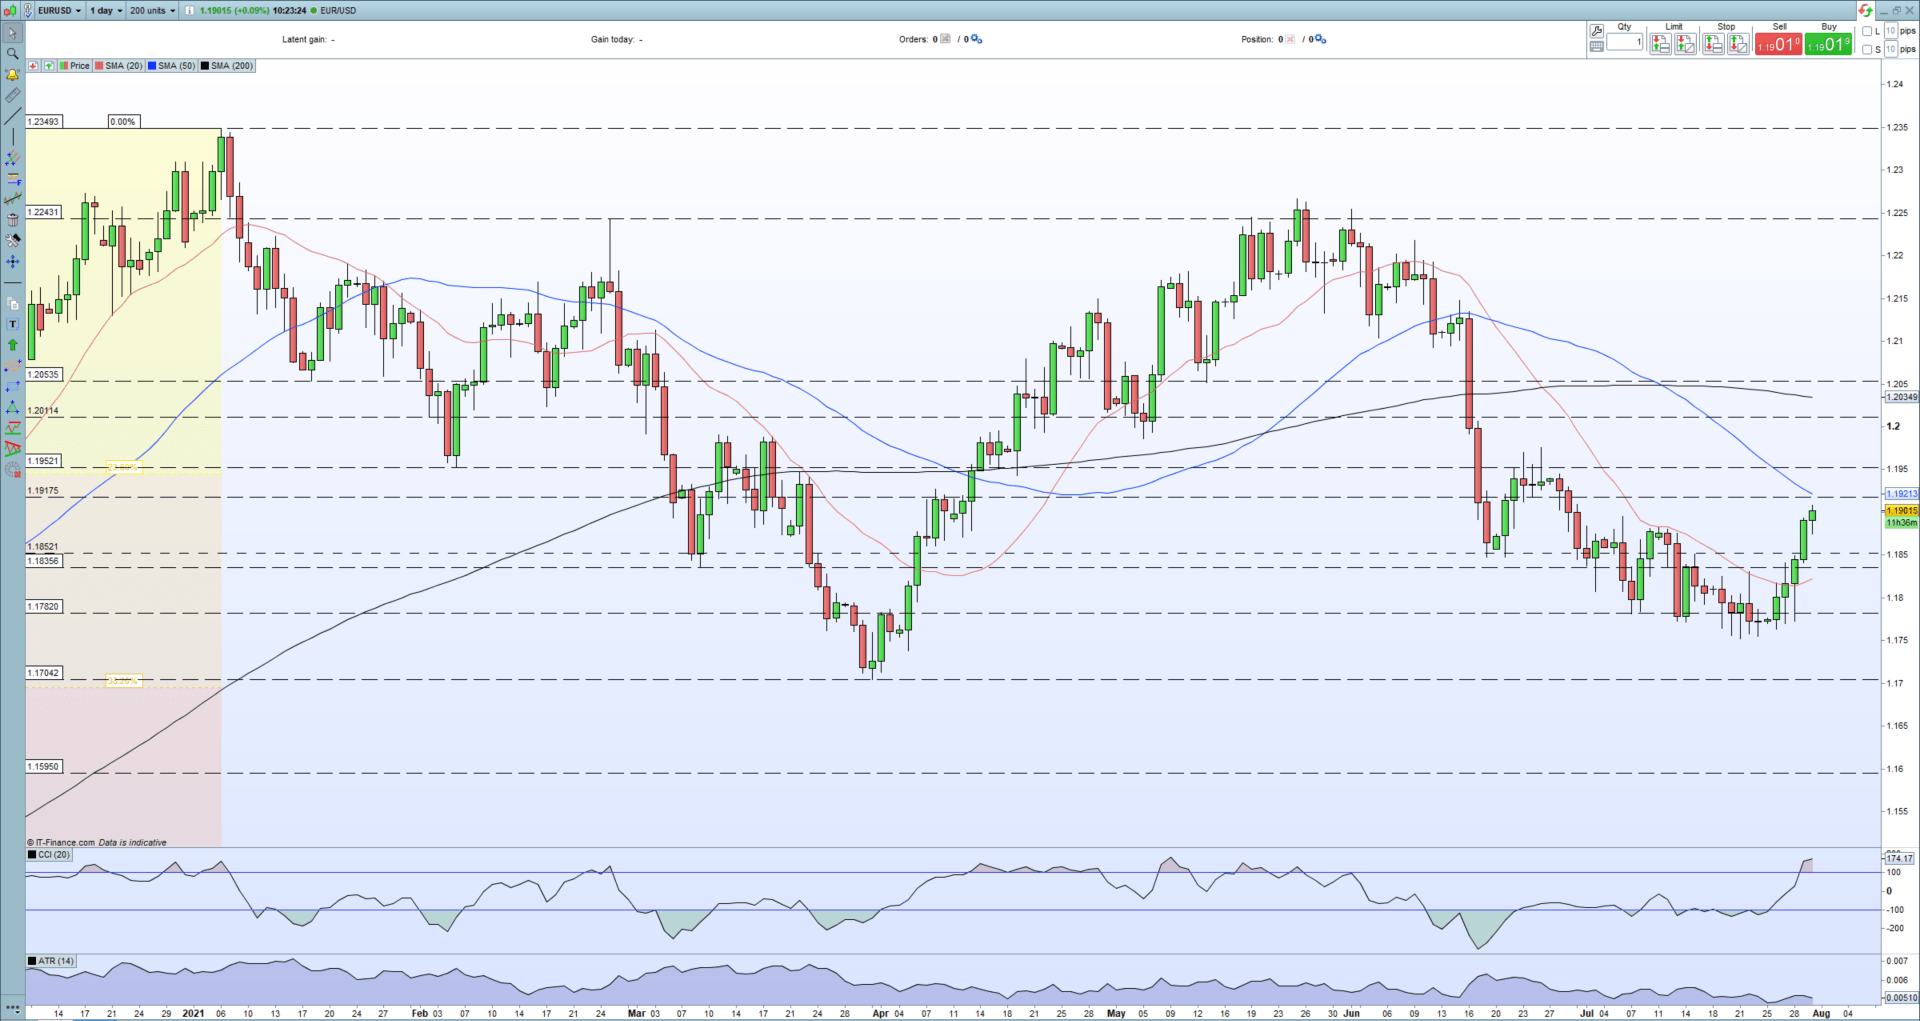
The latest data has helped to underpin the recent EUR/USD rally and has pushed the pair back above 1.1900 for the first time in one-month. Above here, the 23.8% Fibonacci retracement level at 1.1952 becomes the next target/level of resistance. While today’s data has helped the move, the recent US dollar weakness has also played a major part in the rally. The release later today (13:30 BST) of the Fed’s favored measure of inflation, US Core PCE, will now become key in determining if the current move in EUR/USD can be extended into the weekend. In addition, month-end flows may add an extra layer of volatility into the pair.

EUR/USD Daily Price Chart (December 2020 – July 30, 2021)
| Change in | Longs | Shorts | OI |
| Daily | -1% | -4% | -3% |
| Weekly | 4% | -10% | -5% |
Retail trader data show 48.03% of traders are net-long with the ratio of traders short to long at 1.08 to 1. The number of traders net-long is 10.72% lower than yesterday and 23.12% lower from last week, while the number of traders net-short is 14.97% higher than yesterday and 33.67% higher from last week.
We typically take a contrarian view to crowd sentiment, and the fact traders are net-short suggests EUR/USD prices may continue to rise.Traders are further net-short than yesterday and last week, and the combination of current sentiment and recent changes gives us a stronger EUR/USD-bullish contrarian trading bias.
What is your view on EUR/USD – bullish or bearish?? You can let us know via the form at the end of this piece or you can contact the author via Twitter @nickcawley1.


