


S&P 500, HANG SENG INDEX, ASX 200 INDEX OUTLOOK:
- Dow Jones, S&P 500 and Nasdaq 100 closed -0.36%, -0.02%, and +0.41% respectively
- More than 85% of S&P 500 companies have beaten earnings estimates so far this season
- Traders are eyeing the Hang Seng Index (HSI) for a rebound after deep losses this week

FOMC Meeting, Earnings, HSI, Asia-Pacific at the Open:
Wall Street stocks were mixed on Wednesday after the FOMC meeting, which made only minor tweaks from June’s statement. Fed Chair Jerome Powell acknowledge that “ the economy has made progress” towards achieving the central bank’s long-term inflation and employment goals, but “substantial further progress” is needed to warrant starting tapering. The Fed held interest rates unchanged and maintained asset purchases at $120 billion a month, in line with market expectations.
We are seeing the peak in earnings news-flow this week, with most of the FAANG companies having delivered their results. More than 85% of S&P companies have beaten earnings estimates so far, with the blended earnings growth rate at 74.2% YoY, according to Factset. If 74.2% is the actual growth rate for the quarter, it will mark the highest year-on-year earnings growth rate in more than a decade.
The DXY US Dollar Index pulled back for a third day to 92.26 on a more dovish-tilted Fed, buoying precious metal and crude oil prices. Gold climbed to a one-week high of $1,808 and WTI traded at a two-week high of $72.4.
DXY US Dollar Index
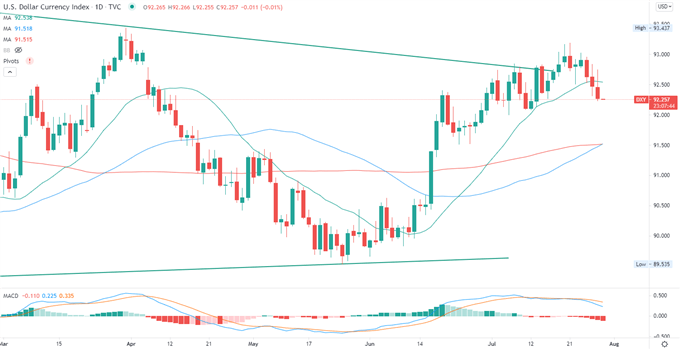
Looking ahead, German unemployment and inflation data headline today’s economic docket alongside US Q2 GDP. Find out more from the DailyFX economic calendar.
Asia-Pacific markets look set to trade broadly higher on Thursday. Hang Seng Index (HSI) futures traded 3% higher before cash market open, pointing to a strong start on Thursday. Futures in Japan, Australia, Hong Kong, South Korea, Taiwan, Singapore and India are in the green, whereas those in mainland China and Thailand are in the red.
Looking back to Wednesday’s close, 7 out of 11 S&P 500 sectors ended lower, with 55.6% of the index’s constituents closing in the red. Energy (+0.97%) and communication services (+0.75%) outperformed, whereas consumer staples (-0.87%) and utilities (-0.69%) lagged behind.
S&P 500 Sector Performance 28-07-2021
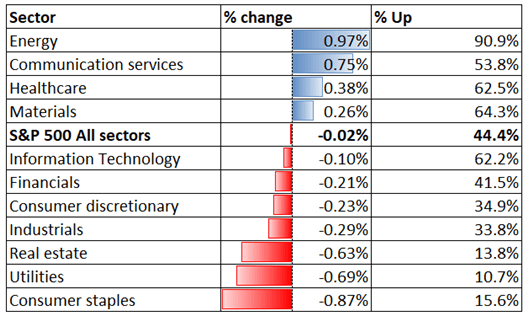
Source: Bloomberg, DailyFX

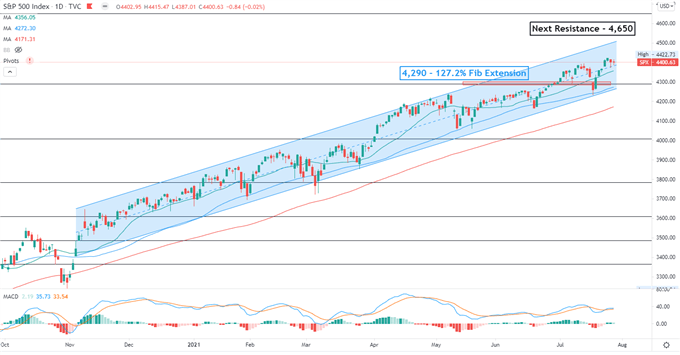
S&P 500 IndexTechnical Analysis
The S&P 500 index is trending higher within an “Ascending Channel” formed since November as highlighted on the chart below. The next key resistance level can be found at 4,650 – the 161.8% Fibonacci extension. The overall trend remains bullish-biased as suggested by the SMA lines.
S&P 500 Index– Daily Chart
Hang Seng Index Technical Analysis:
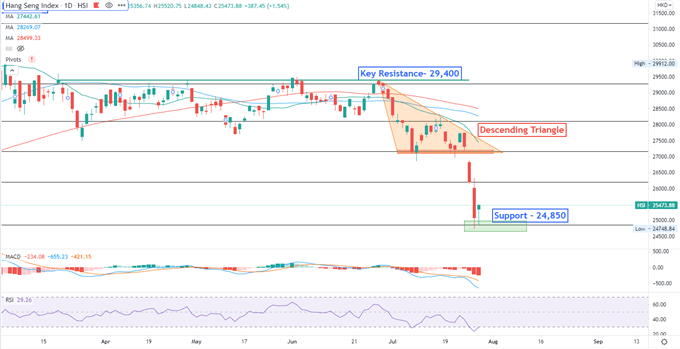
The Hang Seng Index rebounded at a key support level of 24,850 after falling almost 10% in three days. Prices breached below the floor of a “Descending Triangle”, hinting at further consolidation ahead. The overall trend remains bearish-biased however, as the SMA lines have formed a “Death Cross” and trended lower. The MACD and RSI oscillators have both dived deeply in to the oversold territory, suggesting that a technical rebound is likely.
Hang Seng Index – Daily Chart
ASX 200 Index Technical Analysis:
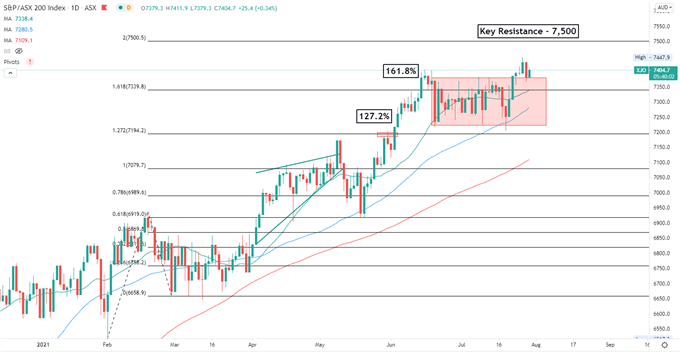
The ASX 200 index breached the ceiling of the range-bound zone, as highlighted on the chart below. Breaking this level may open the door for further upside potential with an eye on 7,500. The overall trend remains bullish-biased, as suggested by the consecutive higher highs and higher lows formed over the past few months. The MACD indicator formed a bullish crossover and trended higher, suggesting that upward momentum is gaining traction.
ASX 200 Index – Daily Chart

--- Written by Margaret Yang, Strategist for DailyFX.com
To contact Margaret, use the Comments section below or @margaretyjy on Twitter


