


FTSE 100 INDEX ANALYSIS
- Company earnings bolster FTSE 100 index.
- Downtrend on UK treasury yields continues.
- Bulls testing rising wedge support.
BROADBASED EUROPEAN EQUITY GAINS
Boost your stock market knowledge with our articles on the types of stocks available, how equities impact the economy, and getting started with stock trading.
The STOXX EUROPE 600 index represents the European equity region and is trading largely higher today after better than expected earnings across various stock sectors. The FTSE 100 is no exception as UK equities followed suit with commodity heavyweights such as Royal Dutch Shell PLC, Rio Tinto PLC and Anglo American PLC posting profits last seen pre-pandemic. This comes on the back of higher commodity prices including crude oil, iron ore, copper and platinum which is reflected in the energy and basic materials sectors outperformance today (see breakdown below):
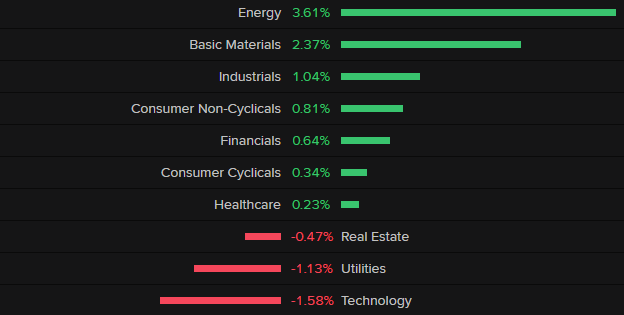
Chart prepared by Warren Venketas, Refinitiv
A fall in new COVID-19 cases as well as the unsurprising decision by the Federal Reserve to maintain interest rates have bolstered bullish market sentiment. The uncertainty (although fading) around China supports investment elsewhere which should provide impetus for additional upside. Similar to U.S. treasuries, the UK 10-year gilt yield has subsequently fallen (see chart below) which is a likely outcome of the shift to investment outside of China. Fundamentally, the FTSE 100 index is primed for continued upside. UK gilt yields represent the opportunity cost of investing in UK stocks therefore, when bold yields fall U.S. stocks become more attractive (as a rule of thumb) and vice versa.
FTSE 100 VS GB 10-YEAR GILT
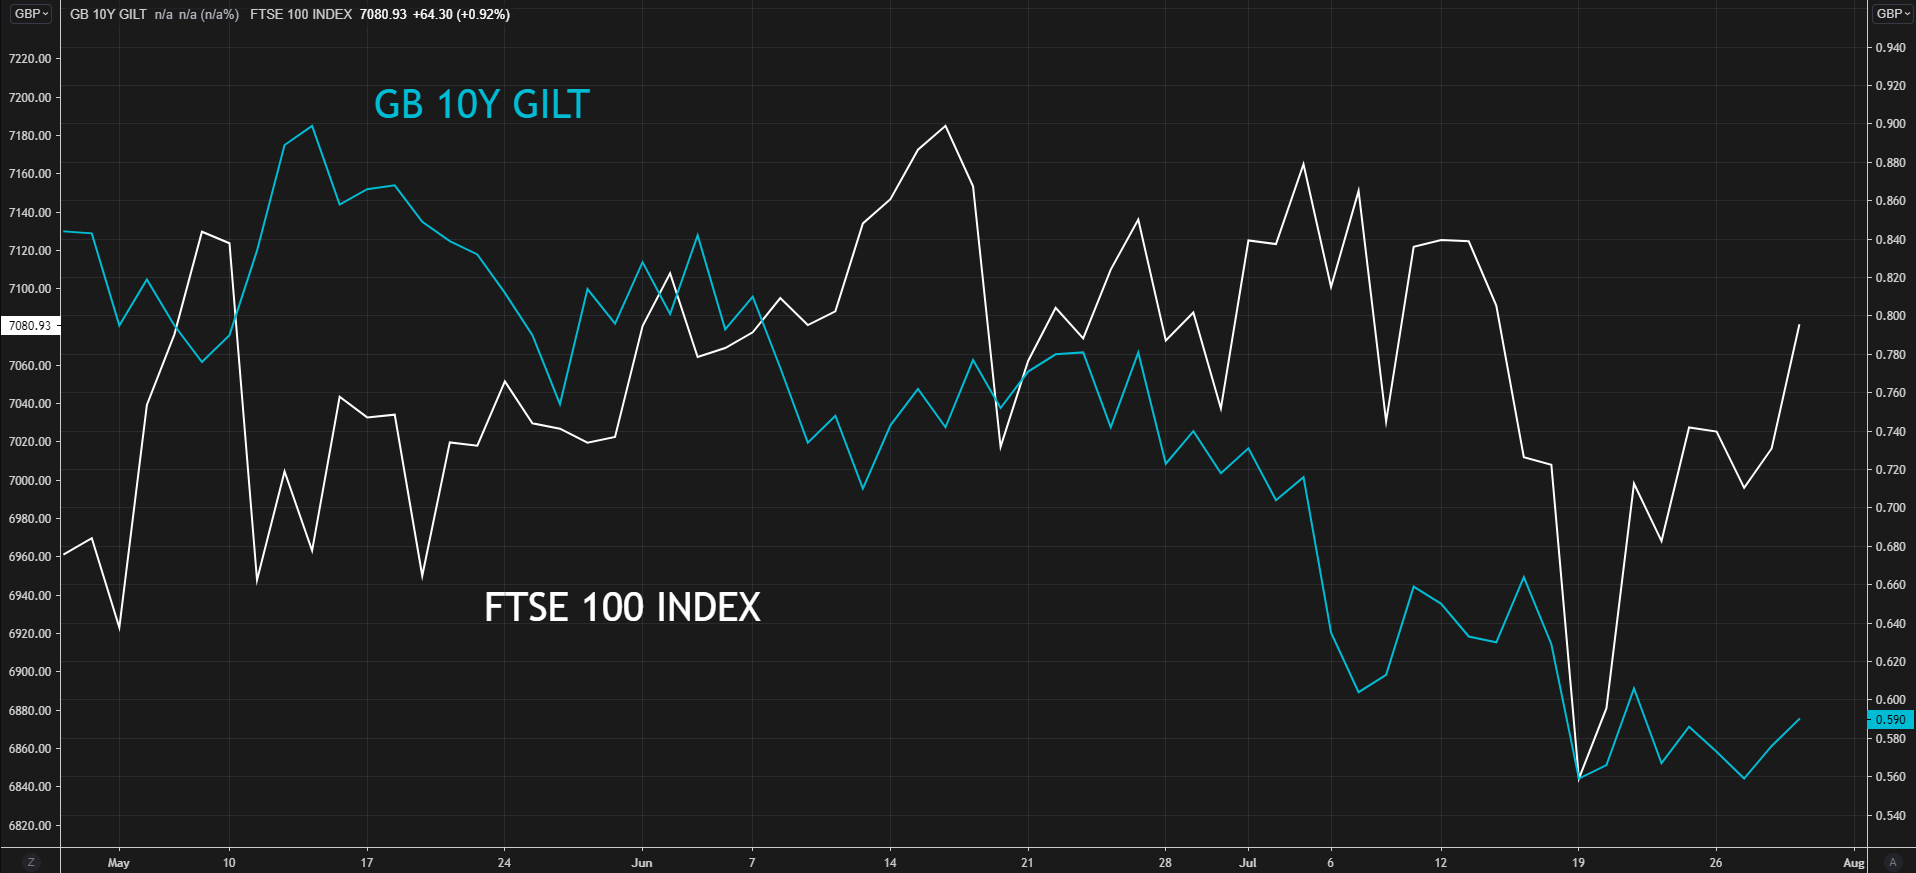
Chart prepared by Warren Venketas, Refinitiv
UPCOMING EARNINGS THIS WEEK
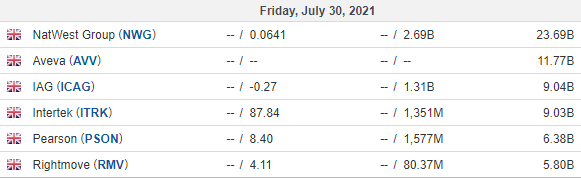
Source: Investing.com
FTSE 100 TECHNICAL ANALYSIS
FTSE 100 Weekly Chart:
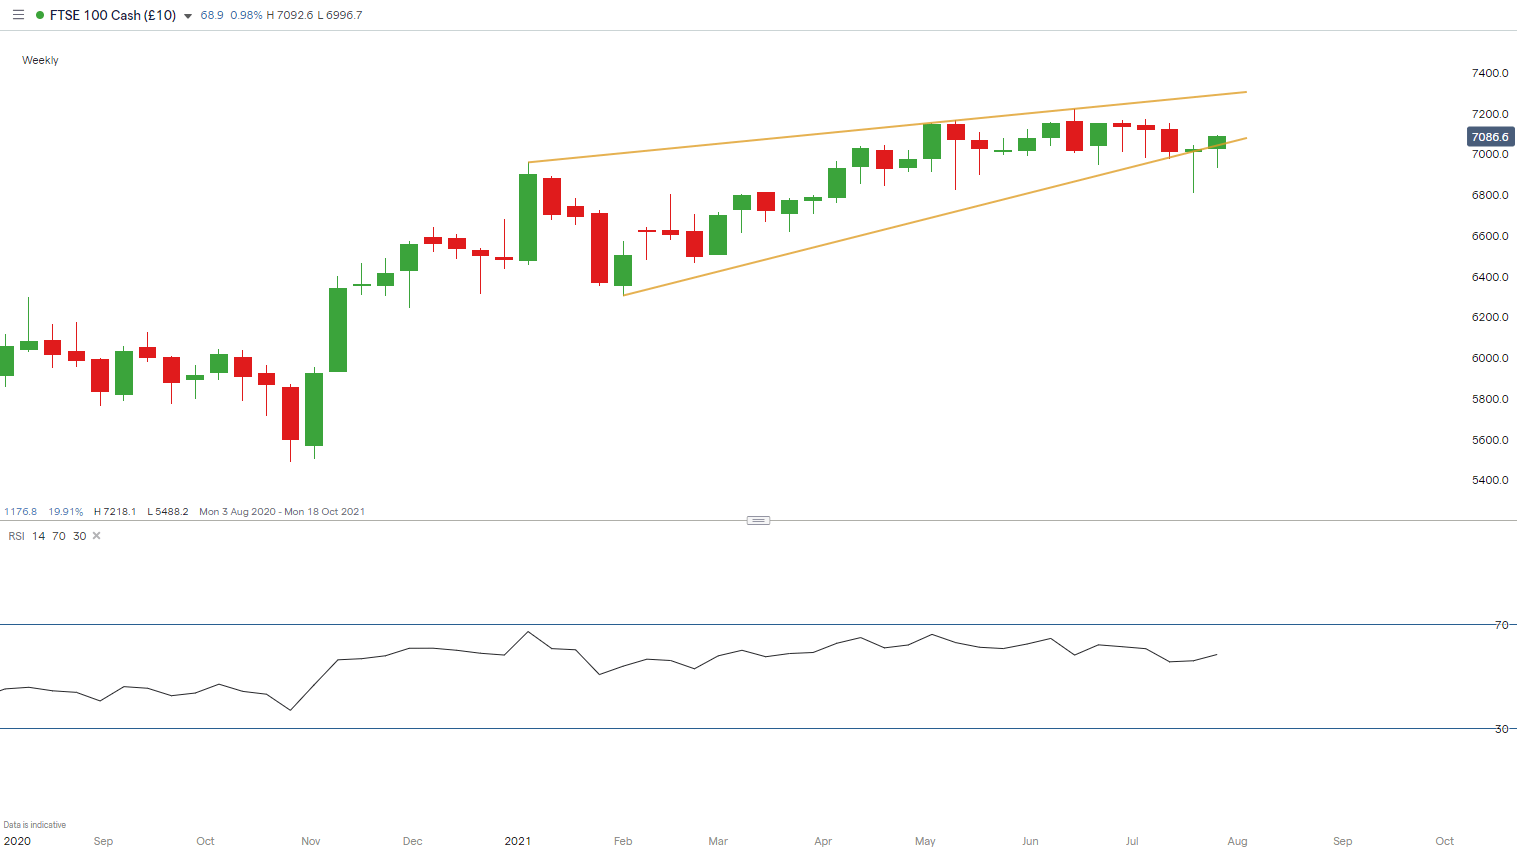
Chart prepared by Warren Venketas, IG
FTSE 100 Daily Chart:
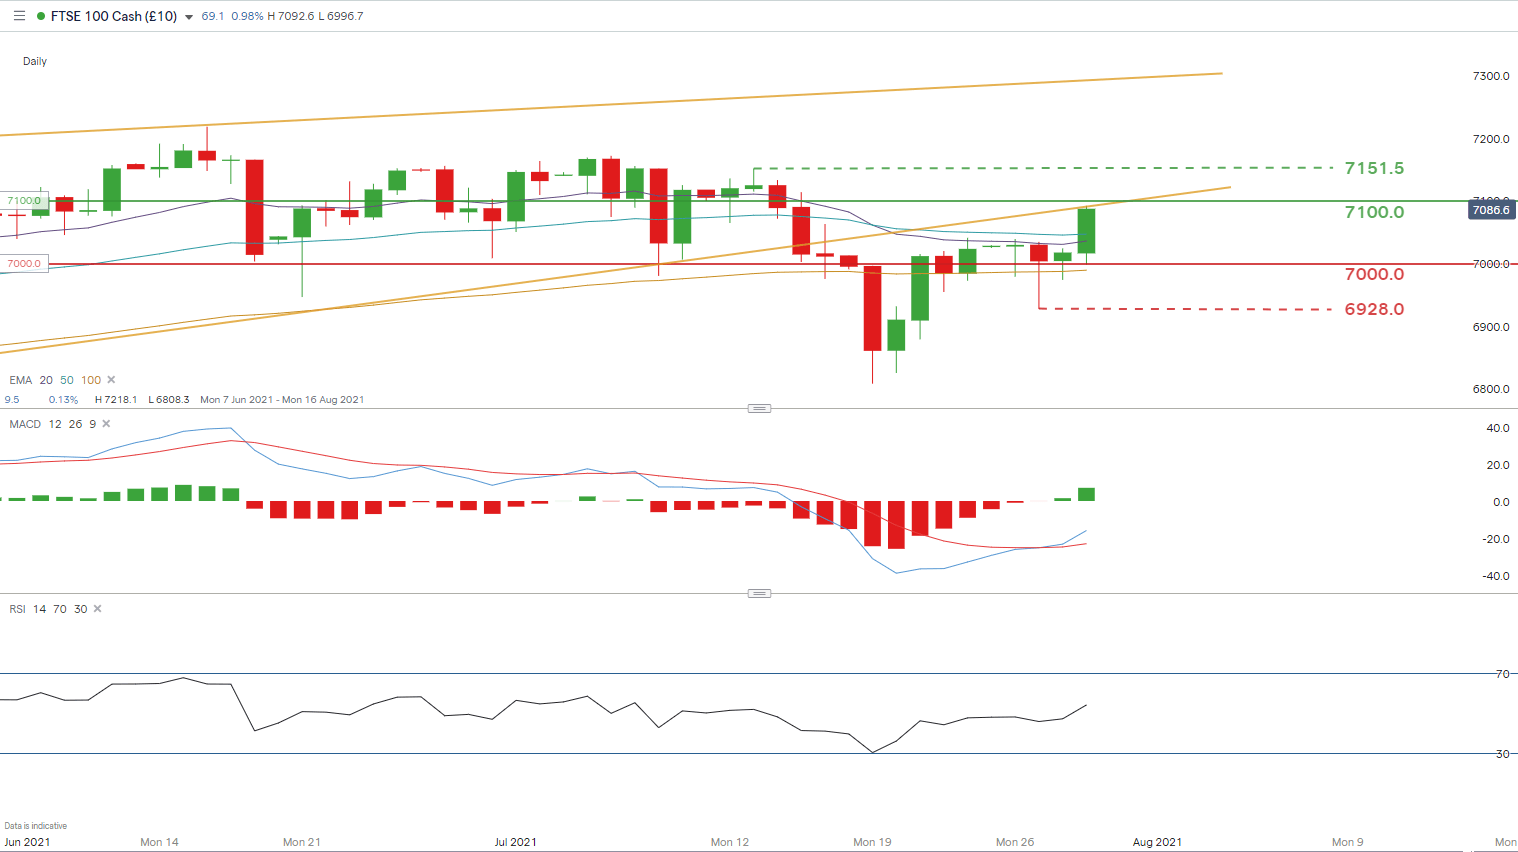
Chart prepared by Warren Venketas, IG
Today, the FTSE 100 is edging toward an uptick of 100 index points from 7000.00 to 7100.00. This resistance zone coincides with the recently broken rising wedge support line (yellow) – see weekly chart above. The Relative Strength Index (RSI) remains slightly above the 50 level which suggests current bullish momentum but could dissipate should resistance hold at the 7100.00 psychological zone.
Price action shows trading above the 100-day EMA confirming the recent shift to the upside. This uptrend may ensue if prices manage to close the week above 7100.00. Should this happen, subsequent resistance will come from the recent swing high at 7151.5.
Form the bearish perspective, initial support will be provided by the 20-day and 50-day EMA’s respectively, after which the 7000.00 key level could come into focus.
--- Written by Warren Venketas for DailyFX.com
Contact and follow Warren on Twitter: @WVenketas


