


NASDAQ 100, HANG SENG, ASX 200 INDEX OUTLOOK:
- Dow Jones, S&P 500 and Nasdaq 100 indexes closed +0.07%, +0.20% and +0.66% respectively
- Both Twitter and Intel beat EPS estimates, but Intel’s forward guidance disappointed investors
- Asia-Pacific markets are positioned to open mixed. Japanese markets are shut for a holiday

Twitter, Intel, Jobless Claims, Asia-Pacific at Open:
Wall Street equities edged toward all-time highs on Thursday as investors digested strong corporate earnings amid revitalized reflation hopes. Asia-Pacific markets however, may continue to trail behind US peers due to the spread of the Delta variant of Covid-19 in the region.
The US earnings season has fared well so far, with around 86% of S&P 500 companies beating analysts’ EPS forecasts. 22 out of 25 companies reported earnings on Thursday have delivered positive surprises, including Twitter and Intel. Here is a quick update:
Twitter:
- EPS at $0.20, versus $0.064 estimate (189% higher)
- Revenue at $1.19 billion, versus $1.06 billion estimate (11.8% higher)
- The resumption of live events and increased brand advertisement boosted 2Q results amid reopening from Covid lockdowns. Pent-up demand among large advertisers could persist in 2H
Intel:
- EPS at $1.28, compared to $1.065 estimate (20% higher)
- Revenue at $18.53 billion, compared to $17.84 billion estimate (4% higher)
- Intel’s share price declined 2% after the company issued cautious guidance on gross margins in Q3 due to supply constraints
- While PC and server shipments may be a bright spot, growth in the semiconductor segment remains lagging behind competitors such as Nvidia and AMD
Meanwhile, weekly initial US jobless claims data fell short of expectations. Some 419k unemployment claims were filed last week, compared to a 350k estimate. The previous week’s figure was revised up to 368k from 360k. A slower-than-expected recovery in the labor market may serve to soothe tapering fears as Fed officials monitor both inflation and employment figures to set monetary policy.
US Weekly Jobless Claims
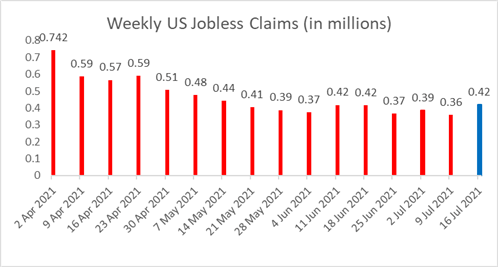
Source: Bloomberg, DailyFX
Asia-Pacific markets look set to end the week on the back foot. Futures in Australia, mainland China, Hong Kong, Taiwan, Singapore and India are in the red, whereas those in South Korea, Malaysia and Thailand are higher. Japanese markets are shut for a public holiday.
Looking back to Thursday’s close, 4 out of 5 Dow Jones sectors ended higher, with 46.7% of the index’s constituents closing in the green. Materials (+1.26%) and information technology (+1.08%) were among the best performers, whereas energy (-1.00%) and financials (-0.99%) trailed behind.
Dow Jones Sector Performance 22-07-2021
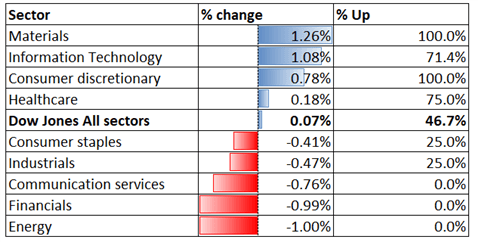
Source: Bloomberg, DailyFX
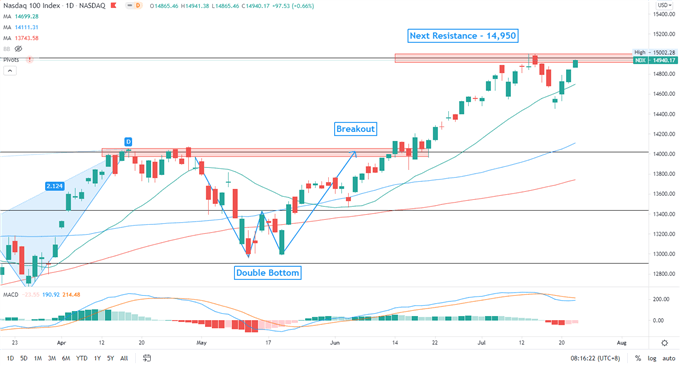
Nasdaq 100 Index Technical Analysis
The Nasdaq 100 index is attempting to breach a key resistance level at 14,950 for a second time. A successful attempt may open the door for further upside potential, whereas a pullback may lead to a test of the 20-Day SMA line for immediate support. The MACD indicator formed a bearish crossover and trended lower, suggesting that upward momentum may be fading.
Nasdaq 100 Index – Daily Chart
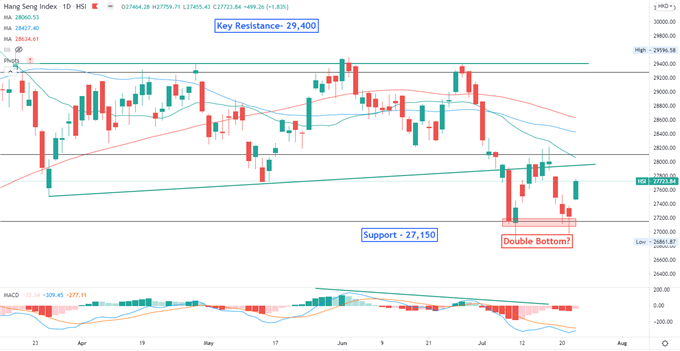
Hang Seng Index Technical Analysis:
The Hang Seng Index looks set to rebound from an immediate support level of 27,150, potentially forming a “Double Bottom” chart pattern. The overall trend remains bearish-biased however, as the SMA lines have formed a “Death Cross” and trended lower. The MACD indicator is about to form a bullish crossover beneath the neutral midpoint, suggesting that near-term selling pressure may be depleting.
Hang Seng Index – Daily Chart
ASX 200 Index Technical Analysis:
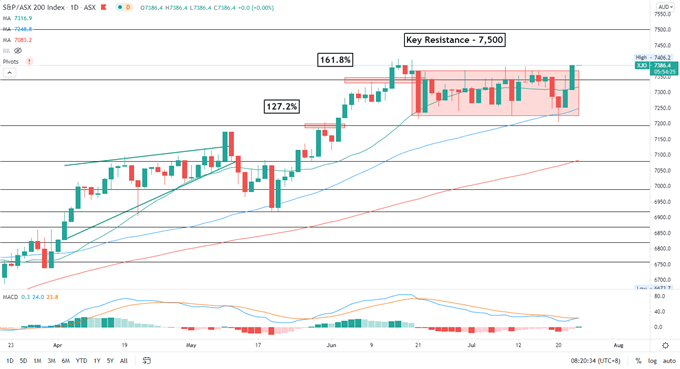
The ASX 200 index is trading in a tight range between 7,230-7,370, waiting for fresh catalysts for a breakout. The overall trend remains bullish-biased, as suggested by the consecutive higher highs and higher lows formed over the past few months. A major resistance level can be found at around 7,500. The MACD indicator is about to form a bullish crossover, suggesting that bullish momentum may be building.
ASX 200 Index – Daily Chart

--- Written by Margaret Yang, Strategist for DailyFX.com
To contact Margaret, use the Comments section below or @margaretyjy on Twitter


