


USD/JPY ANALYSIS
- COVID-19 fears benefits Yen
- USD/JPY options expiry could buoy recent upside today
- IG Client Sentiment (IGCS) points to short-term bullish move
JAPANESE YEN FUNDAMENTAL BACKDROP
2021 has not been a phenomenal year for the Yen against the U.S. Dollar, but recent COVID-19 concerns regarding the Delta variant has given USD/JPY bears some hope (see chart below). The correlation between COVID-19 concerns as new cases (global) rise and Yen strength is quite evident from the chart. Should new cases continue to rise, we could see subsequent Yen strength.
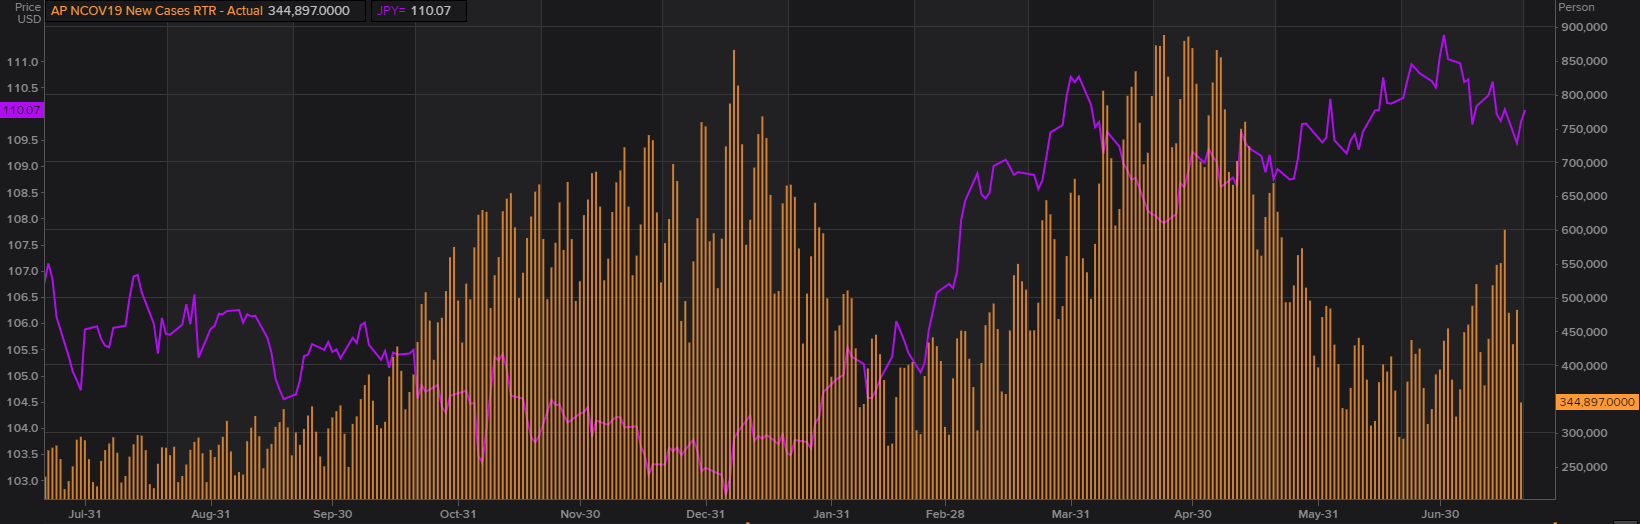
Source: Refinitiv
USD/JPY OPTION EXPIRY LATER TODAY
The below option expiry strikes could play a significant role today as traders may keep prices above the 110.00 level to close off positions in-the-money. As a general rule of thumb, when large option positions expire, prices tend to move in the direction of that specific strike.
FX options expire 10-am New York/3-pm London - Wednesday July 21
USD/JPY: 110.00-15 (1BLN), 110.50 (820M)
Source: Reuters
USD/JPY TECHNICAL ANALYSIS

USD/JPY Weekly Chart:

Chart prepared by Warren Venketas, IG
Price action has shown a pullback from 2021 highs in late June. This falls in line with the rising new COVID-19 cases as mentioned above. The retreat back below the long-term trendline resistance zone (black) could suggest additional Yen strength toward the 109.00 psychological level.
Both the MACD indicator and Relative Strength Index (RSI) provide bearish signals as highlighted in red and blue respectively. The RSI shows bearish divergence as prices increase while slowing upside momentum is reflected on the oscillator. Continuation of the recent pullback could ensue in the medium-term should COVID-19 continue on its current trajectory.
USD/JPY Daily Chart:
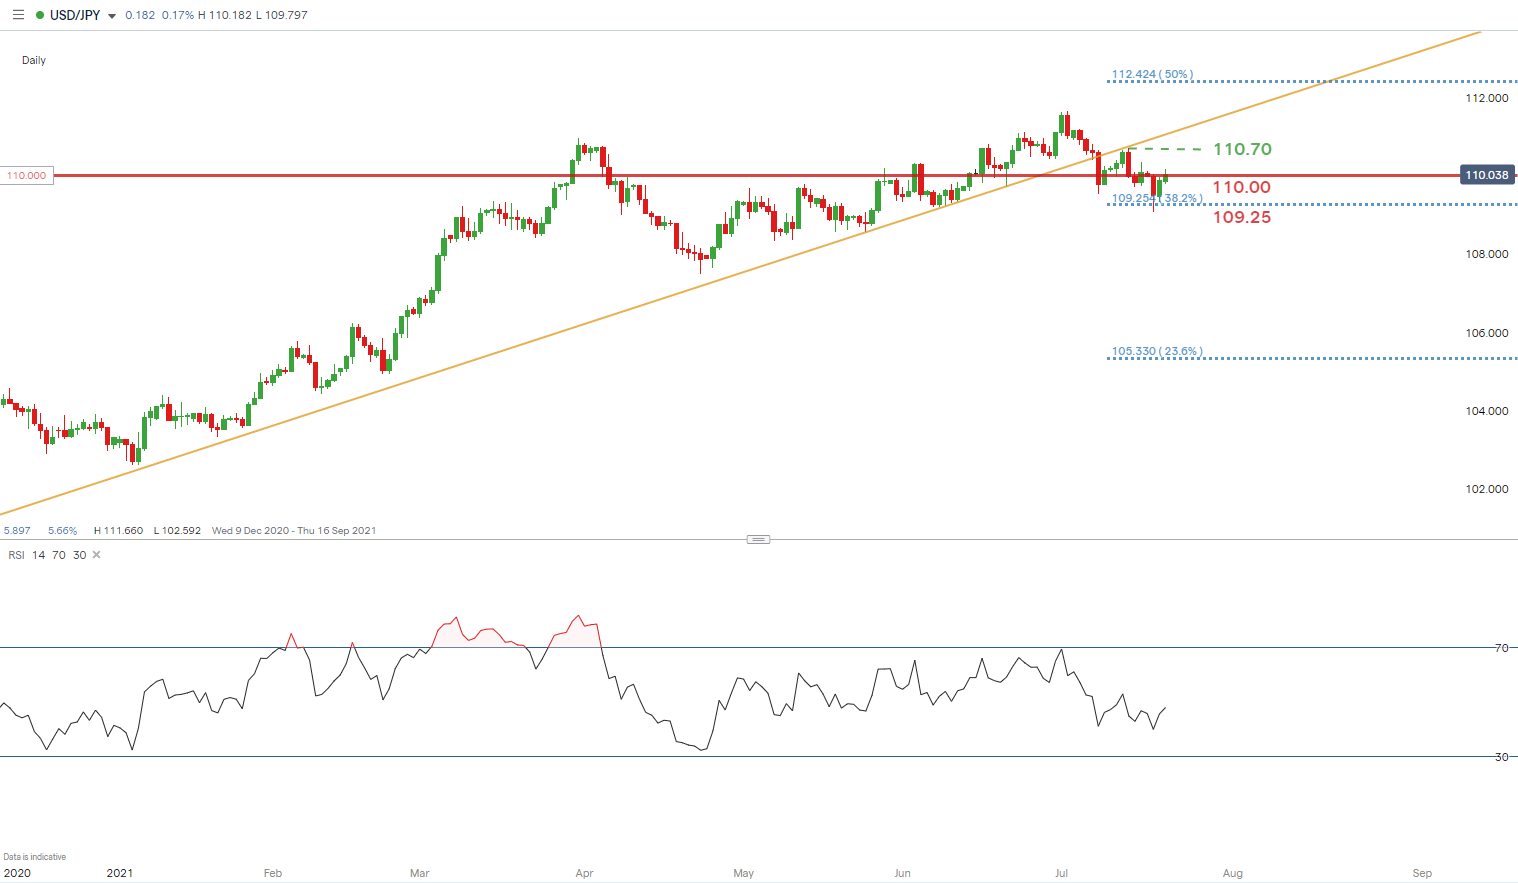
Chart prepared by Warren Venketas, IG
After the break below the support trendline (yellow) in early July, USD/JPY bulls have not been able to push back against the reversal. Maintaining prices above 110.00 has been a struggle but with todays options expiries, it is possible this may be the case leading up to expiry. Post-expiry there may be a move downward toward the 38.2% Fibonacci level at 109.25 – Fibonacci taken from June 2015 high to June 2016 low.
From the bullish perspective, the recent swing high at 110.70 will serve as initial resistance however, this may be unlikely with the current fundamental backdrop.
IG CLIENT SENTIMENT INDICATING SHORT-TERM UPSIDE
| Change in | Longs | Shorts | OI |
| Daily | -2% | 2% | 0% |
| Weekly | 12% | -16% | -6% |
IGCS shows retail traders are currently net short on USD/JPY, with 53% of traders currently holding short positions (as of this writing) and because we take a contrarian view at DailyFX, the suggestive bias is bullish.
--- Written by Warren Venketas for DailyFX.com
Contact and follow Warren on Twitter: @WVenketas


