


Gold Price Forecast:
- Gold is surrounded by important technical levels ahead of a week with serious market-moving potential
- That said, gold traders may wait to make their move until after next week’s FOMC rate decision
- Bitcoin vs Gold: Top Differences Traders Should Know
Gold Price Forecast: Is This The Calm Before The Storm?
Gold finds itself at a crossroad ahead of a major week for markets. While the current trading week began with a bang in many risk-sensitive assets, gold has enjoyed relatively calm price action and teeters on the brink of a range breakout should US Treasury yields continue to slip. With the July FOMC rate decision fast approaching and gold on the precipice of a potential rally or reversal, price action may slow until the event risk has passed in what could be called the “calm before the storm.”
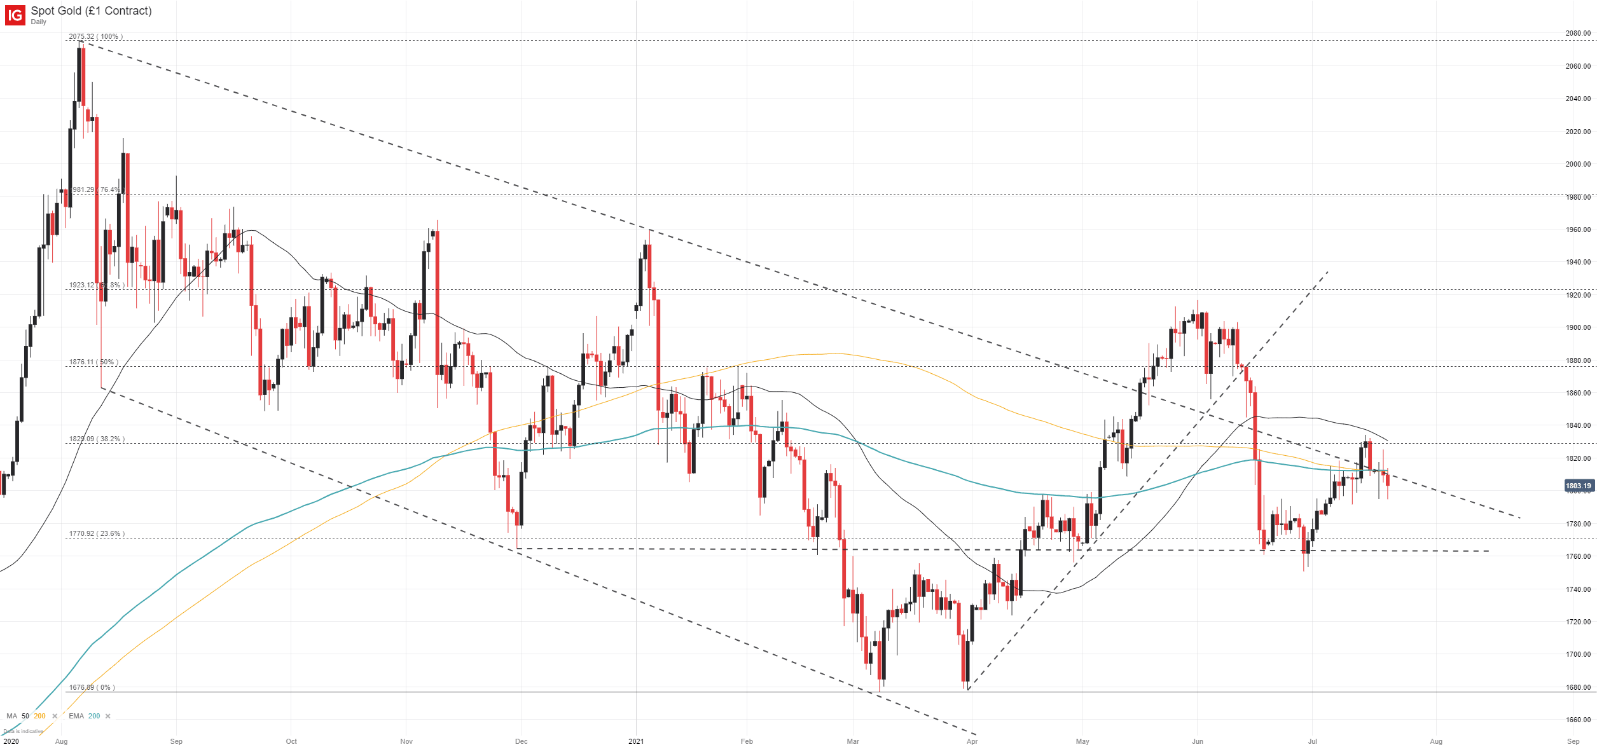
Gold (XAU/USD) Price Chart: Daily Time Frame (July 2020 - July 2021)
How to Trade Gold: Top Gold Trading Strategies and Tips
That said, a flurry of nearby technical levels will also look to keep gold contained until an appropriate catalyst arrives. To the topside resides the 50-day simple moving average, a recent swing high near $1835 and a Fibonacci level, all of which may make it difficult to establish progress higher.

Not far from the current spot price resides the 200-day simple and exponential moving averages as well as a descending trendline from August. The trendline marks the topside of the descending channel that has been in play since August 2020 and has served as resistance numerous times in the last year.
Gold (XAU/USD) Price Chart: 4 - Hour Time Frame (February 2021 - July 2021)
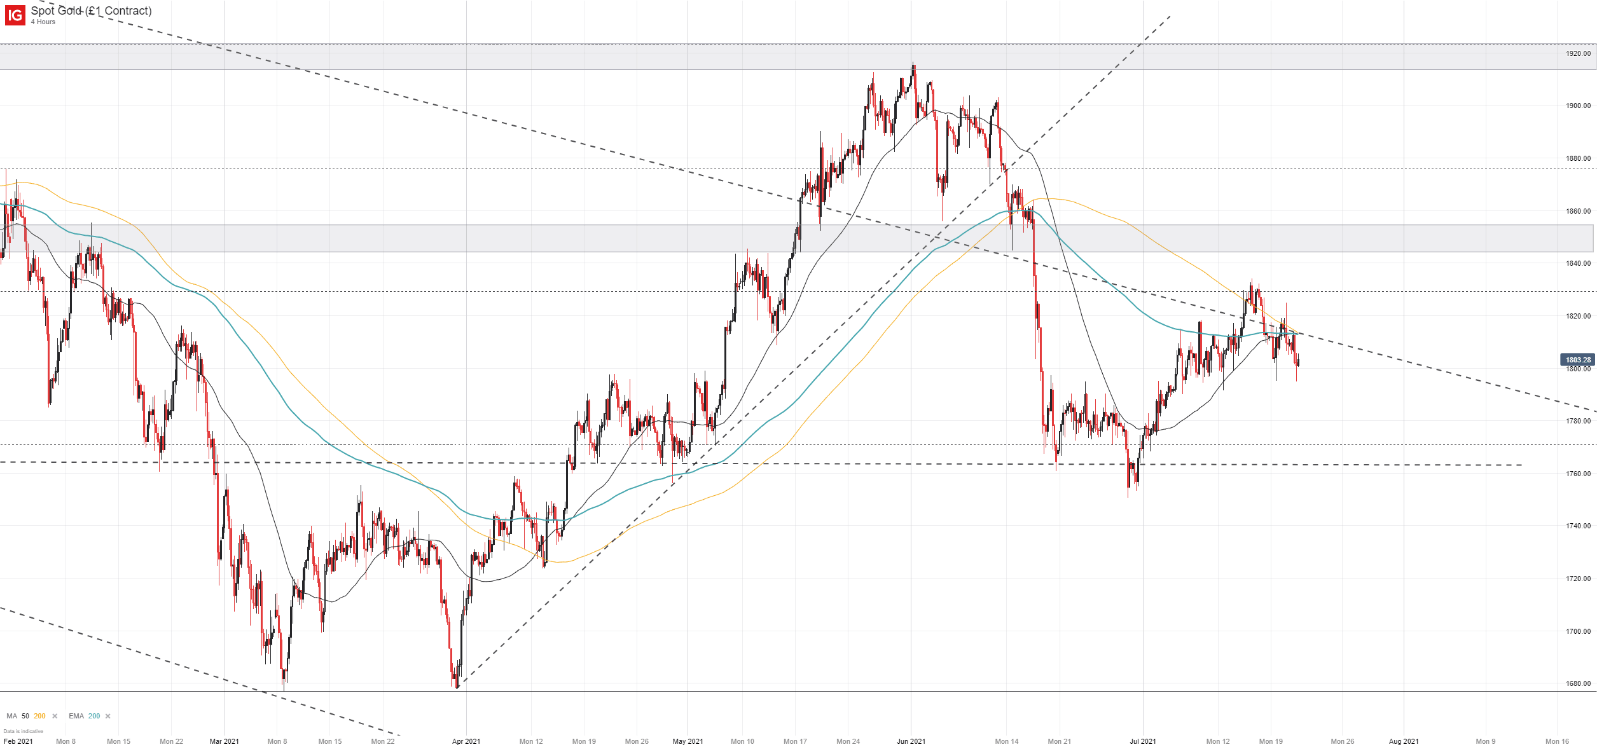
Evidently, the collection of major technical levels and moving averages make the landscape difficult to navigate but can also open the door to multiple trading strategies. Breakout trading, range trading, and swing trading strategies may all prove applicable given the current price chart and one’s own directional bias. Trading at such a pivotal point on the chart, the coming days could lead the way for a longer-term trend in gold prices. Nevertheless, patience may prove to be the most prudent option at this stage as Fed meetings have a tendency to spark market movement.

In addition to insights and commentary from the Federal Reserve, US traders will look to earnings from the country’s largest technology companies as roughly 40% of S&P 500 components are set to report in the week ahead. While summer trading conditions have often worked to subdue volatility, the potential for price movement next week appears high and gold looks to be coiled like a spring. In the meantime, follow @PeterHanksFX on Twitter for updates and analysis.
--Written by Peter Hanks, Strategist for DailyFX.com
Contact and follow Peter on Twitter @PeterHanksFX


