


DOW JONES, HANG SENG INDEX, ASX 200 INDEX OUTLOOK:
- Dow Jones, S&P 500 and Nasdaq 100 indexes closed +1.62%, +1.52% and +1.23% respectively
- Cyclical sectors outperformed defensive ones as viral concerns eased
- Hong Kong’s Hang Seng Index may rebound after falling 0.84% on Tuesday

Dow Rebound, Netflix Earnings, Hang Seng Index, Asia-Pacific at Open:
Wall Street stocks rebounded sharply on Tuesday, erasing most of Monday’s losses as investors shrugged off viral concerns and refocused on the reflation trades. Cyclical-oriented industrials, financials and consumer discretionary were among the best performing sectors. The tech-heavy Nasdaq 100 gained 1.23%.
Netflix reported second quarter results that fell short of market expectations. Its share price fell more than 3% during the after-hour trade before paring losses. EPS came in at $3.11, compared to a $3.36 forecast. Paid net subscribers additions of 1.54 million was the 1.19 million estimate however. The company posted a tempered 3Q guidance for 3.5 million new subscribers, which is almost 40% lower than consensus. This may put pressure on its price as investors have to adjust their expectations for subscriber growth reacceleration in the second half when new content is released.
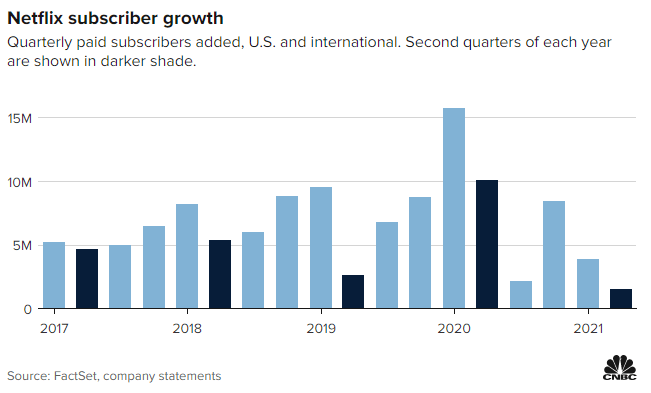
Source: CNBC
Looking ahead, the Westpac leading index dominates the economic docket today alongside the Australia’s retail sales growth figure. Find out more from the DailyFX economic calendar.
Asia-Pacific markets are positioned for a mixed start of the day. Futures in Japan, Australia, Hong Kong, Taiwan, Singapore and India are in the green, whereas those in mainland China, South Korea, Taiwan, Malaysia and Thailand are in the red.
Hong Kong’s Hang Seng Index (HSI) lost 2.55% so far this week amid a renewed wave of selling from mainland investors. Some HK$ 4.69 billion net Southbound outflows were registered on Tuesday, following Monday’s HK$ 1.78 billion (chart below). So far this month, mainland investors have sold HK$ 25 billion worth of Hong Kong stocks, reflecting a weakening appetite as Beijing tightened regulatory curbs on large tech firms. The near-term sentiment for the HSI may be tilted to the downside.
Hang Seng Index vs. Daily Southbound Net Flow
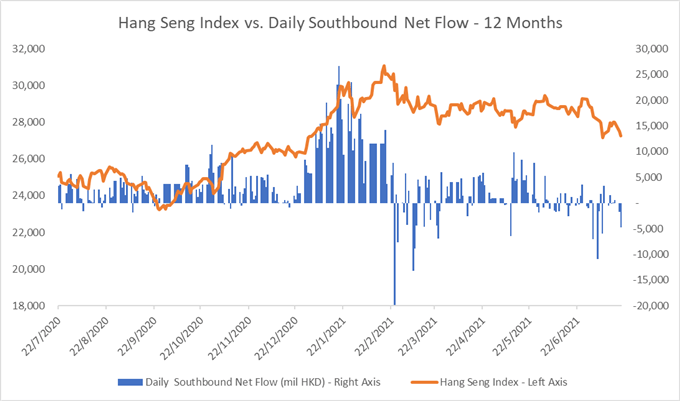
Source: Bloomberg, DailyFX
Looking back to Tuesday’s close, all 9 Dow Jones sectors ended higher, with 86.7% of the index’s constituents closing in the green. Industrial (+3.3%), financials (+2.29%) and consumer discretionary (+1.89%) were among the best performer, whereas consumer staples (+0.12%) trailed behind.
Dow Jones Sector Performance 20-07-2021
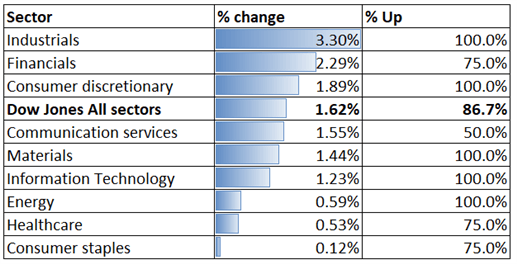
Source: Bloomberg, DailyFX
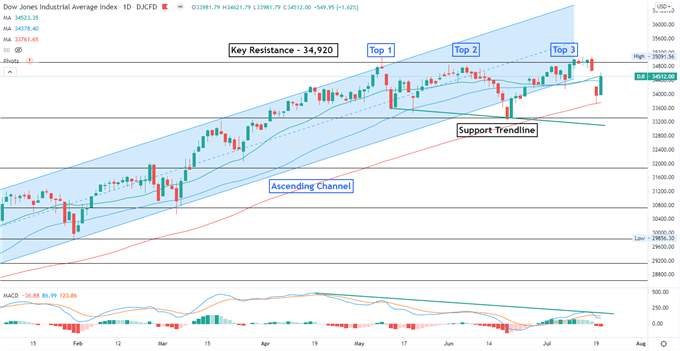
Dow Jones Index Technical Analysis
The Dow Jones index pulled back from a key resistance level at 34,920 and has entered a technical correction. The index has likely formed a “Triple Top” chart patten after failing to breach this level for three attempts. A “Triple Top” chart pattern flags the risk of a major trend reversal if prices break the supporting trendline as shown on the chart below. Bearish MACD indicator also suggests that upward momentum may be fading.
Dow Jones Index – Daily Chart
Hang Seng Index Technical Analysis:
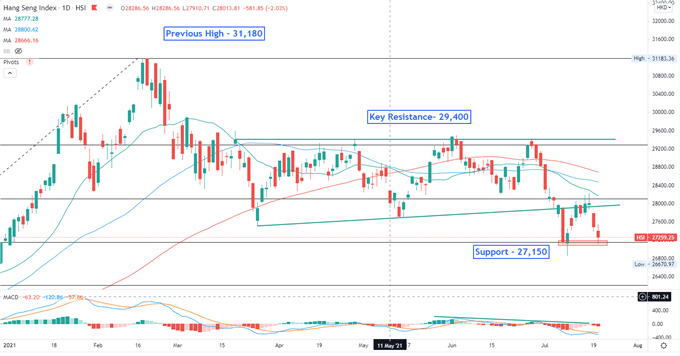
The Hang Seng Index looks set to rebound from an immediate support level of 27,150, potentially forming a “Double Bottom” chart pattern. The overall trend remains bearish-biased however, as the SMA lines have formed a “Death Cross” and trended lower. The MACD indicator has dived below the neutral line, suggesting that the index may be under near-term selling pressure.
Hang Seng Index – Daily Chart
ASX 200 Index Technical Analysis:
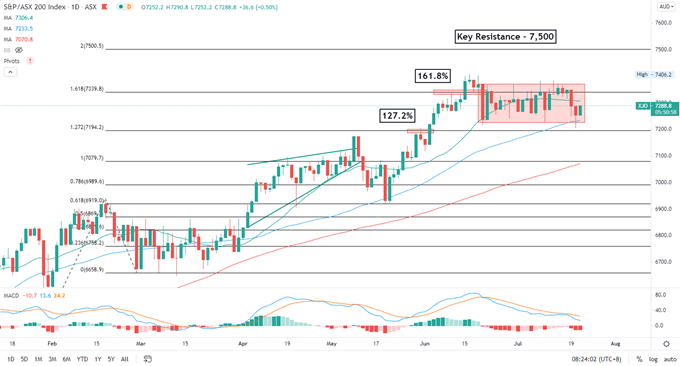
The ASX 200 index is trading in a tight range between 7,230-7,370, waiting for fresh catalysts for a breakout. The overall trend remains bullish-biased, as suggested by the consecutive higher highs and higher lows formed over the past few months. A major resistance level can be found at around 7,500. The MACD indicator is trended lower, suggesting prices may continue to range bound in the near term.
ASX 200 Index – Daily Chart

--- Written by Margaret Yang, Strategist for DailyFX.com
To contact Margaret, use the Comments section below or @margaretyjy on Twitter


