


Key Talking Points:
- GBP/USD is attempting to hold its ground against a rising US Dollar
- FTSE 100 bounces off 7,000 after its recent pullback

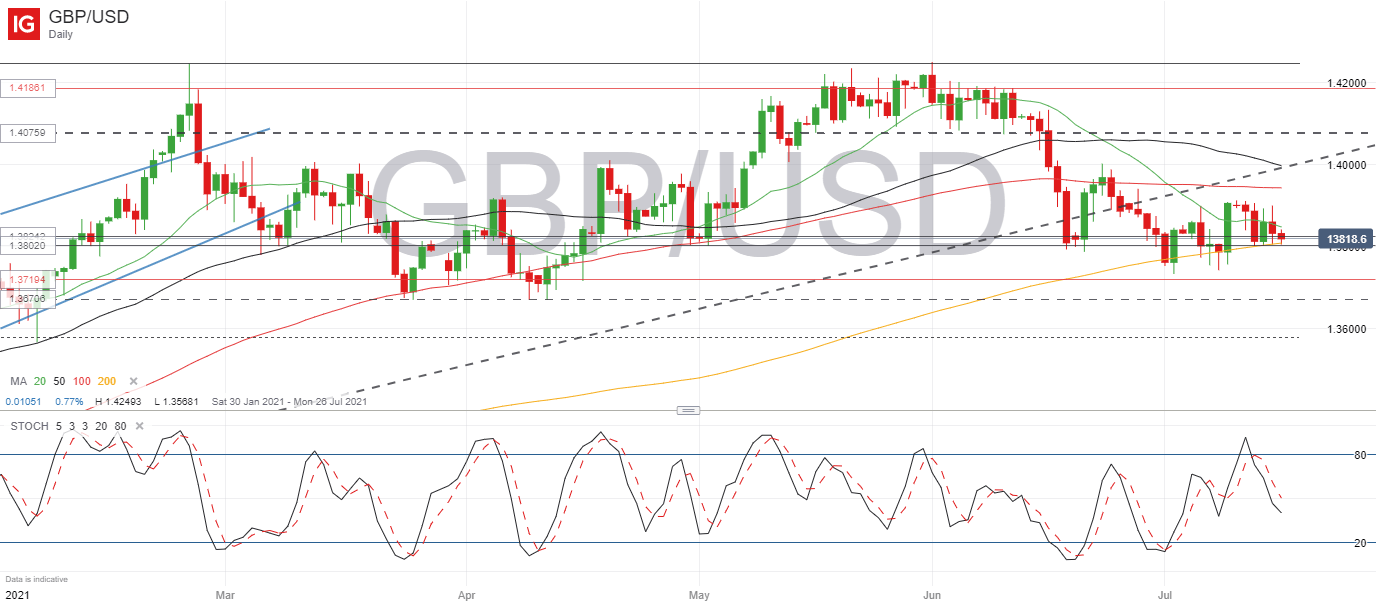
GBP/USD is attempting to hold its ground above 1.3802. This area has been significant for the last 4 months, having stopped a bearish reversal on at least three prior occasions, but the pair is facing increased selling pressure amid a rising Dollar, which could see price action break below this level of support.
If so, watch out for lower lows on the daily chart as that would increase bearish pressure towards the next area of support between 1.3719 and 1.3670. Looking ahead, we’ve seen some hawkish comments from Bank of England members which means that the August MPC meeting could provide some tailwinds for the Pound, picking up momentum along the way if more hawkish continue to appear. This is in contrast to the Federal Reserve, which continues to stand by its “transitory” argument seeming to keep changes to monetary policy on hold. The central bank will have its next meeting at the end of the month so things may change after the latest US CPI and PPI data, but GBP/USD could turn around if the Fed stands its ground once again.
GBP/USD Daily chart
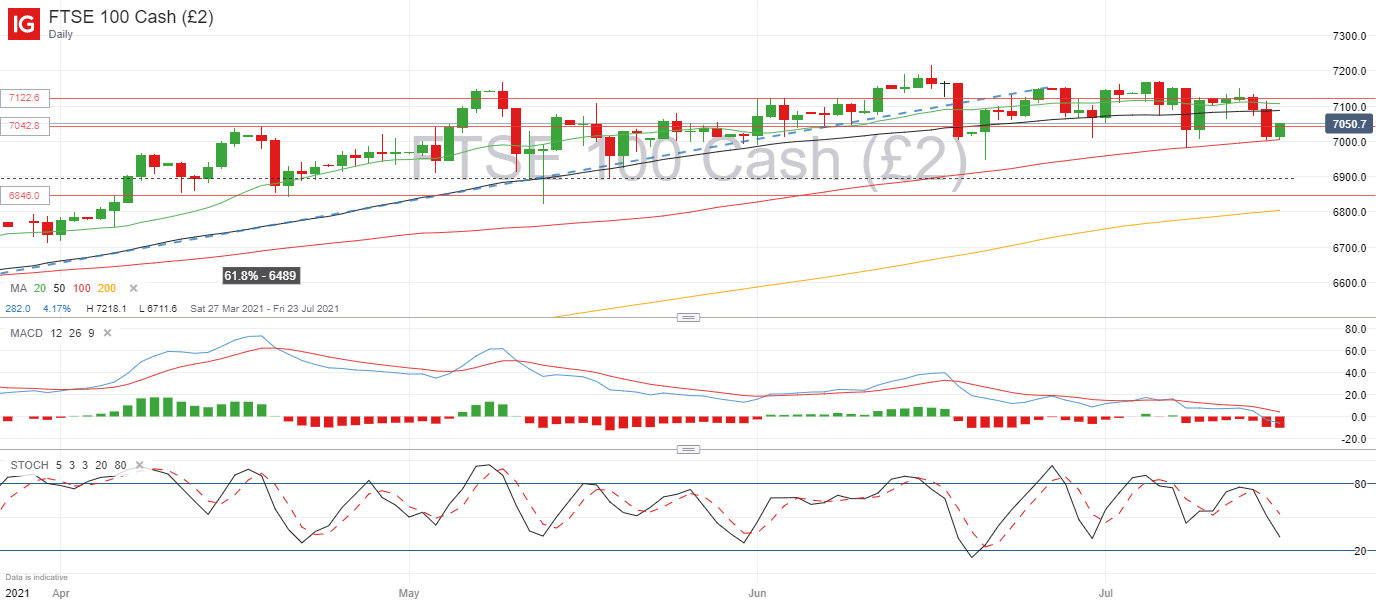
In the stock market, the FTSE 100 has seen increased selling pressure as commodity prices continue to soften. The oil and gas sector of the blue-chip index has been the main outperformer in the latest sessions threatening to break below the 7,000 mark for a second time this month, highlighting the struggles buyers have to keep the pair at recent highs. The virus situation in the UK is worrying employers as the NHS tracking system is keeping many workers at home after they get “pinged” for being in close contact with someone who has developed Covid-19. The uncertainty about the path of interest rates is also weighing down on UK stocks, as flexible monetary conditions allow equities to achieve higher valuations.
The daily chart is showing continued support for the FTSE 100 around the 7,000 mark but there is a good chance that the index will fall below this level if bearish pressure increases during today’s session. The upside also seems limited above 7,122 which may lead to another bout of range trading in the coming sessions.
FTSE 100 Daily Chart

Learn more about the stock market basics here or download our free trading guides.
--- Written by Daniela Sabin Hathorn, Market Analyst
Follow Daniela on Twitter @HathornSabin


