


GOLD PRICE OUTLOOK:
- Gold prices held gains at around $1,810 despite a stronger US Dollar
- US core CPI figure topped market’s expectations, boosting gold’s appeal as an inflation-hedge asset
- Traders are eyeing $1,815 for near-term resistance, breaching which may lead to further gains

Gold prices traded modestly higher during Wednesday’s APAC session despite a stronger US Dollar and higher yields. Prices appeared to be underpinned by a stronger-than-expected US core CPI data overnight, which bolstered the appeal of the yellow metal as a perceived inflation-hedge asset. June’s figure came in at 4.5% YoY, compared to a 4.0% forecast (chart below). This also marks the highest core CPI reading since 2008, underscoring mounting price pressures that may prompt Fed officials to consider tightening sooner.
As a result, both 2- and 10-year Treasury yields climbed, exerting downward pressure on equities and precious metals as the opportunity cost of holding them rises. The DXY US Dollar index rebounded to 92.81 before pulling off slightly, capping the upside potential for bullion.
This morning, the RBNZ’s hawkish shift stunned investors. The central bank decided to end the large-scale asset purchase (LSAP) program by July 23rd, marking the first major western central bank to exit the pandemic-era monetary stimulus. Improved labor market condition and economic outlook may also pave the way for the RBNZ to raise interest rates as soon as next year. For gold, this serves as a warning sign as other central banks may be following the RBNZ’s path to gradually normalize monetary policy.
US Core CPI (YoY)– Past 12 Months
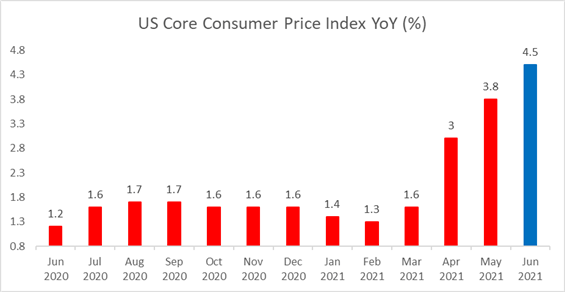
Source: Bloomberg, DailyFX
Gold Price Technical Analysis
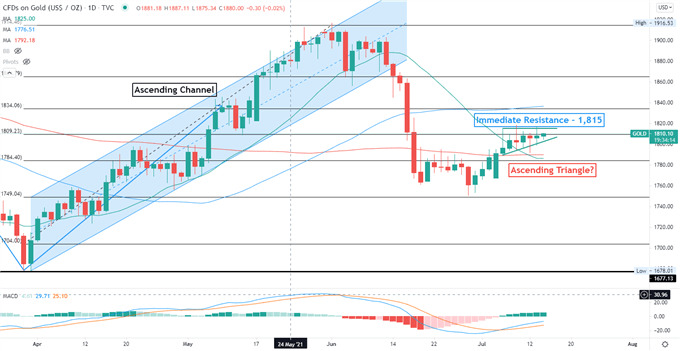
Technically, gold prices have likely formed an “Ascending Triangle” (chart below), which hints at further gains if prices breach above the pattern’s ceiling. An immediate resistance level can be found at $1,815. The supporting trendline of the “Ascending Triangle” may be viewed as an immediate support. The MACD indicator formed a bullish crossover and trended higher, suggesting that bullish momentum is building.
Gold - Daily Chart
| Change in | Longs | Shorts | OI |
| Daily | 1% | -3% | -1% |
| Weekly | 2% | -8% | -2% |
--- Written by Margaret Yang, Strategist for DailyFX.com
To contact Margaret, use the Comments section below or @margaretyjy on Twitter


