


New Zealand Dollar Technical Forecast
- NZD/CAD’s recent swing high confirms bullish Falling Wedge pattern
- NZD/CHF’s downward channel may break as technical outlook brightens
- AUD/NZD on pace to record a fourth consecutive weekly move lower

NZD/CAD Technical Forecast
The New Zealand Dollar’s technical posture has improved against the Canadian Dollar recently, with NZD/CAD rising 0.87% week-to-date. Price appears to be hitting a resistance level at the 38.2% Fibonacci retracement from the April to June swing high/low. The recent deflection also marks a contact point at a descending resistance trendline stemming from the multi-year swing high back in February.
Moreover, the confirmation of that descending trendline has completed the formation of a Falling Wedge pattern, which gives a bullish bias to the currency pair. Thus, a break above the resistance trendline may result in a breakout. However, prices may continue to range within the limits of the cone-shaped pattern in the short term.
NZD/CAD 8-Hour Chart

Chart created with TradingView
NZD/CHF Technical Forecast
The New Zealand Dollar has also made progress this month against the Swiss Franc, although not to the degree seen against the Canadian Dollar. Month-to-date, NZD/CHF is up just over 0.10%. The currency pair has traded in a Descending Channel since moving lower from a multi-year swing high made in late February.
The 23.6% Fibonacci retracement level from the February to June high/low appears to be providing a degree of support. A break lower would see price approach the rising 200-day SMA. Alternatively, the upper limit of the downward channel poses the most immediate resistance level. If price were to break above that level, the 38.2% Fib and the 100-day SMA present technical barriers.
NZD/CHF 8-Hour Chart
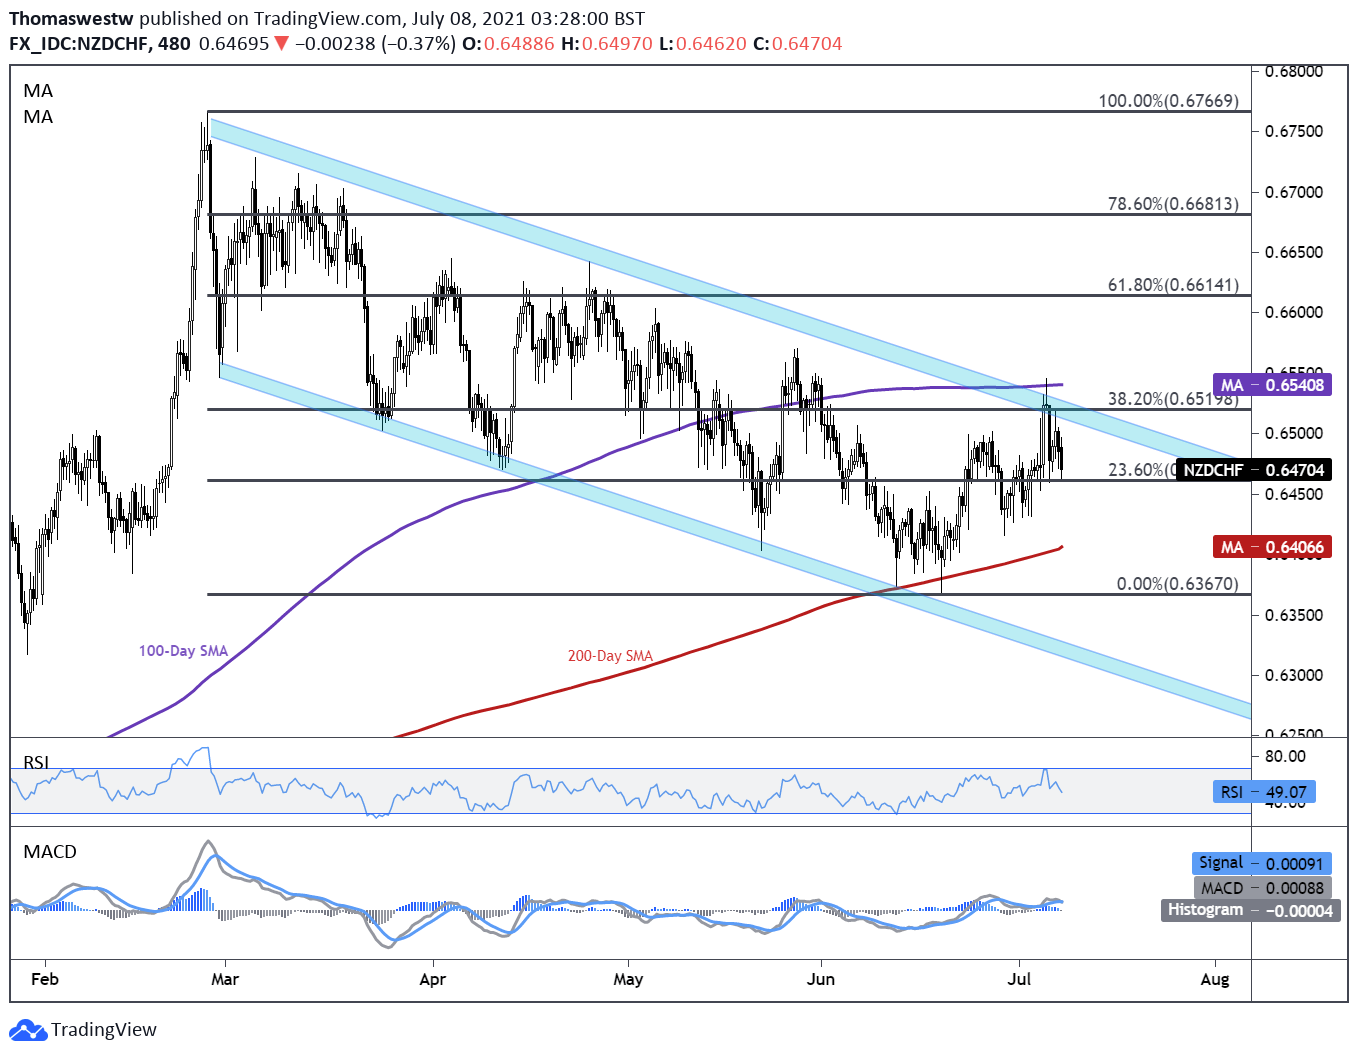
Chart created with TradingView
AUD/NZD Technical Forecast
The New Zealand Dollar has strengthened against the Australian Dollar, with AUD/NZD on track to drop for a fourth consecutive week. The currency pair has traded within a Descending Channel since the June swing high. Support and resistance within the downward channel have been seen throughout the Fibonacci levels set from the May to June high/low.
Furthermore, overhead pressure from the descending 26-period Exponential Moving Average (EMA). If price remains on the current downward path, the 78.6% Fib level is the next barrier to clear before moving lower. Beyond that level puts the May swing low in view. MACD is indicating continued pressure to the downside, although the Relative Strength Index (RSI) is rebounding above its oversold level.
AUD/NZD 8-Hour Chart
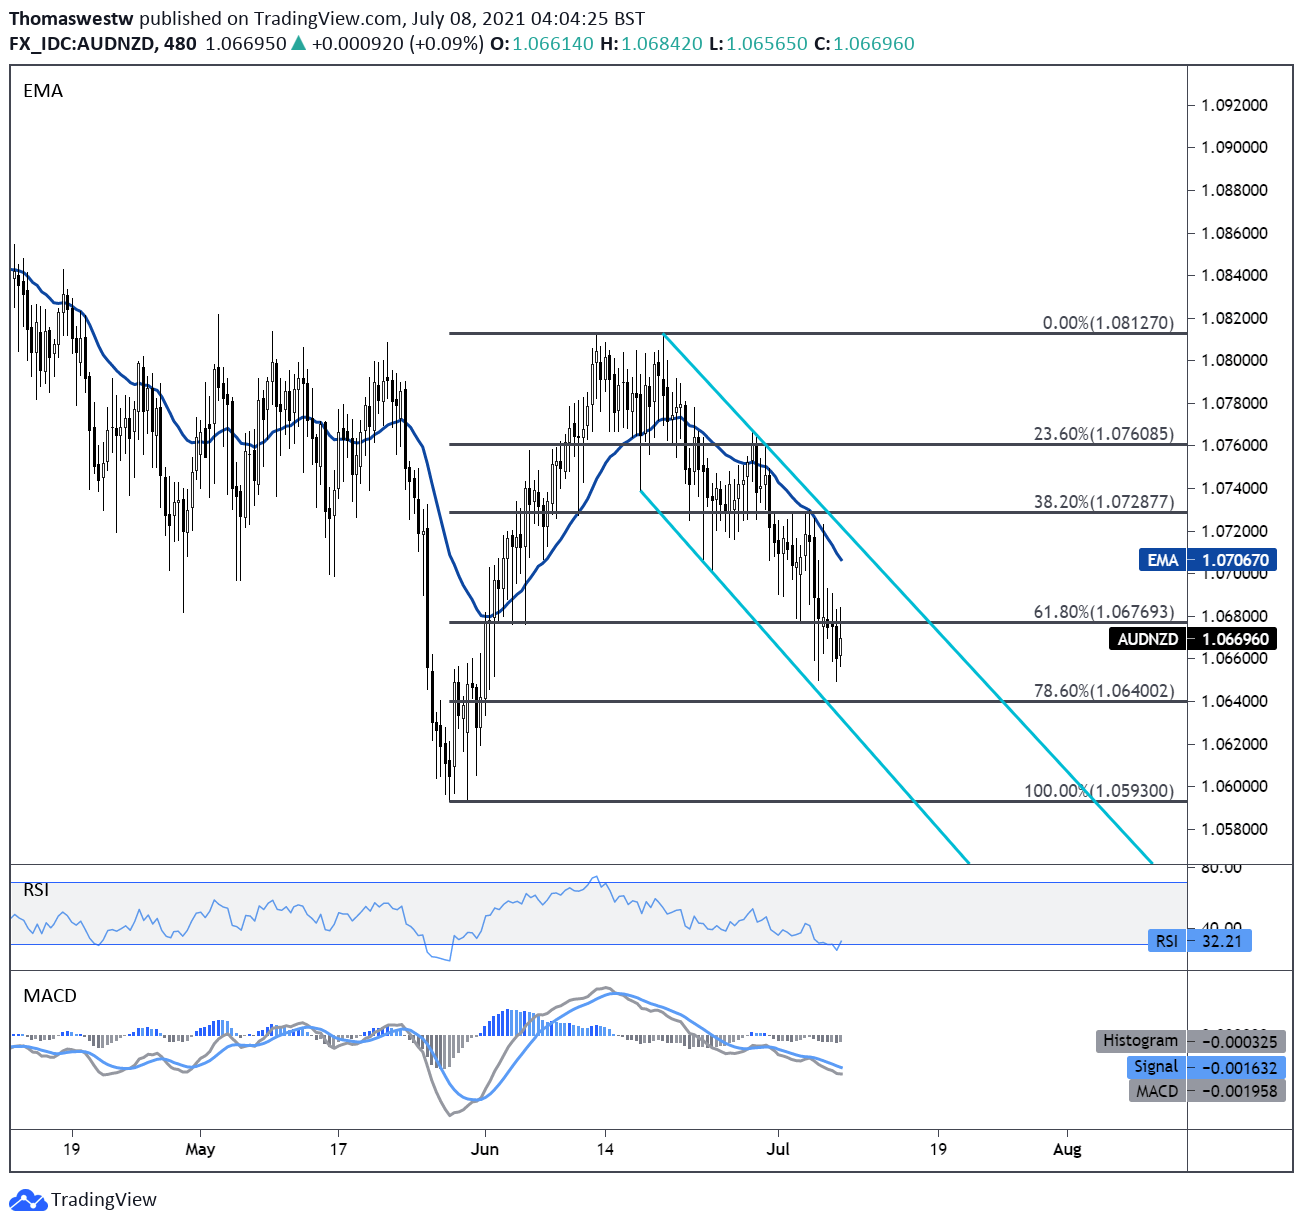
Chart created with TradingView
New Zealand Dollar TRADING RESOURCES
- Just getting started? See our beginners’ guide for FX traders
- What is your trading personality? Take our quiz to find out
- Join a free webinar and have your trading questions answered
- Subscribe to the DailyFX Newsletter for weekly market updates
--- Written by Thomas Westwater, Analyst for DailyFX.com
To contact Thomas, use the comments section below or @FxWestwater on Twitter


