


NASDAQ 100, NIKKEI 225, ASX 200 INDEX OUTLOOK:
- Dow Jones, S&P 500 and Nasdaq 100 indexes closed +0.44%, +0.75% and +1.15% respectively
- Beijing’s latest crackdown on Didi Chuxing weighed on Hong Kong’s tech sentiment
- The RBA is expected to hold policy rate unchanged and twist its QE program

RBA Meeting, Oil Rally, HK Tech Pullback, Asia-Pacific at Open:
US equity futures are extending higher during early morning APAC trade after the Independence Day holiday. The Nasdaq 100 index rallied 1.15% to an all-time high on Friday, lifted by large-cap stocks such as Alphabet (+2.30%), Amazon (+2.27%) and Microsoft (+2.23%).
The technology sector regained strength amid a renewed wave of lockdowns caused by the Delta variant of the Covid-19 virus around the globe. The upcoming earnings season could provide the stock market another boost as analysts forecast a solid period of growth. This may pave the way for Nasdaq 100 to attempt higher highs in the weeks to come.
In Hong Kong, tech sentiment was weighed on by Beijing’s latest crackdown on Didi Chuxing – the country’s largest ride-hailing service provider. The company was listed in the New York exchange just five days ago before the Cyberspace Administration of China (CAC) ordered app stores to remove it due to data and privacy laws violations. The Hang Seng Tech index plunged 2.28% on Monday, as investors mulled a further tighten up of regulatory controls over tech firms.
Daily Performance of Nasdaq 100 Top 10 Stocks – 02-07-2021
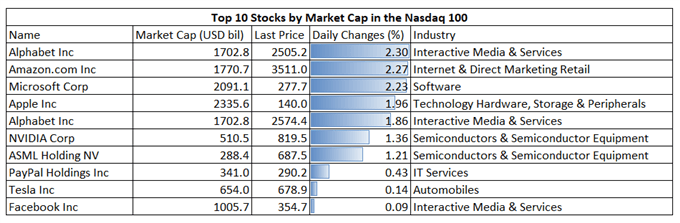
Source: Bloomberg, DailyFX
Crude oil prices rallied 1.5% to fresh two-and-half year highs after an OPEC+ meeting ended without a deal on Monday. Disputes between Saudi Arabia and the United Arab Emirates (UAE) appear to have escalated, preventing the oil cartel from agreeing on a 400k bpd production hike in August. Higher crude oil prices could feed inflationary pressures around the globe, strengthening the case for tapering central bank stimulus.
The RBA meeting will be under the spotlighttoday. The central bank is expected to keep interest rate unchanged, while extending its bond-purchasing program. The emerging of Delta variant is putting half of Australia’s population under stay-at-home restrictions. Against this backdrop, the RBA may maintain its accommodative monetary policy and be patient in withdrawing the pandemic-era stimulus.
Asia-Pacific markets look set to trade mixed today. Futures in Japan, Australia, South Korea, Taiwan, Singapore and Thailand are in the green, whereas those in mainland China, Hong Kong, Malaysia and India are in the red.

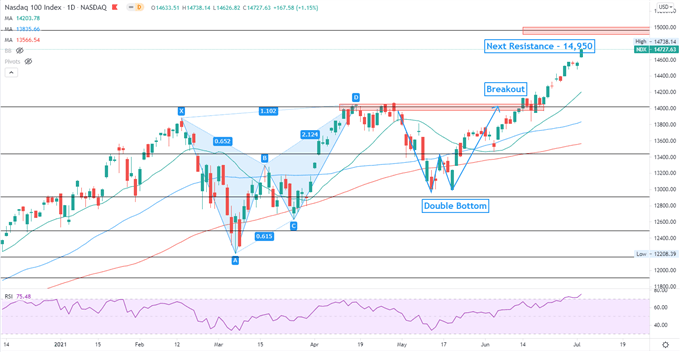
Nasdaq 100 IndexTechnical Analysis
The Nasdaq 100 index breached a key resistance level at 14,013, thus opening the door for further upside potential. Prices may aim for higher highs in the days to come and the overall trend remains bullish-biased. The next major resistance can be found at 14,950 – the 261.8% Fibonacci extension. The RSI oscillator penetrated into the 70 mark, suggesting that prices may be temporarily overbought and vulnerable to a technical pullback.
Nasdaq 100 Index– Daily Chart
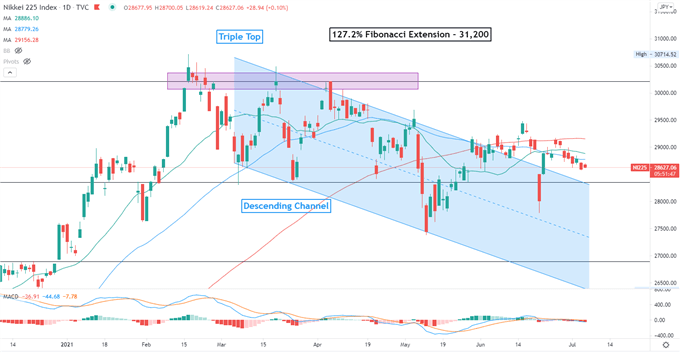
Nikkei 225 Index Technical Analysis:
The Nikkei 225 index failed to breach immediate resistance at the 100-day SMA line and entered into consolidation. An immediate support level can be found at 28,360 – the 100% Fibonacci extension. The next key resistance level can be found at 30,200- the 127.2% Fibonacci extension and where the “Triple Top” resistance lies. The MACD indicator is flattening at around the neutral line, suggesting that prices may be lack of a clear direction.
Nikkei 225 Index – Daily Chart
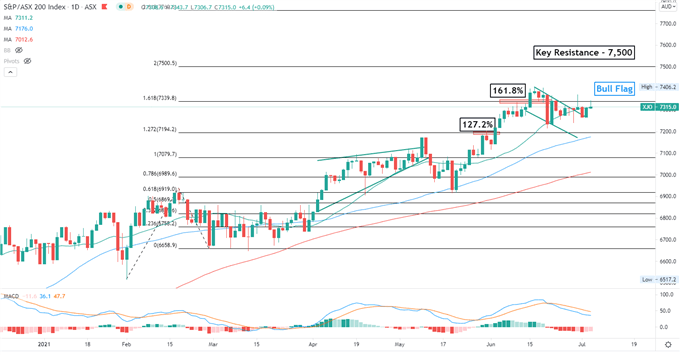
ASX 200 Index Technical Analysis:
The ASX 200 index pulled back from its all-time highs and entered a technical correction. Prices have likely formed a “Bull Flag” pattern, which hints at further upside potential after a period of consolidation. Immediate support levels can be found at the 20-day SMA line (7,310) and then 7,200 – the 127.2% Fibonacci extension. The overall bullish trend remains intact, although the MACD indicator is showing near-term price weakness.
ASX 200 Index – Daily Chart

--- Written by Margaret Yang, Strategist for DailyFX.com
To contact Margaret, use the Comments section below or @margaretyjy on Twitter


