


GOLD PRICE OUTLOOK:
- Gold prices are hovering near two-week highs after the US Dollar weakened
- Traders are eyeing $1,800 resistance, breaching which may lead to further gains
- Minutes from the June FOMC meeting will be in focus this week

Gold - Daily Chart
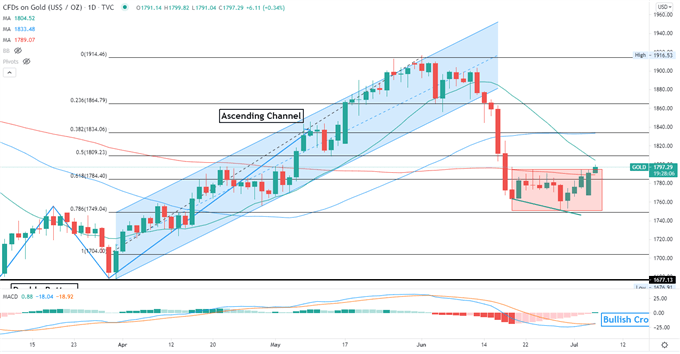
Gold prices are attempting to breach the $1,800 resistanceduring Tuesday’s APAC session, marking a 5-day winning streak. A successful attempt would likely intensify near-term buying pressure and carve a path for prices to attempt higher levels. The next resistance can be found at around $1,809 – the 50% Fibonacci retracement.
Bullion is bolstered by a weaker US Dollar, which makes the precious metal more appealing to holders of other currencies. The latest US nonfarm payrolls report strengthened the prospects for the US economic recovery, yet the pace of job growth didn’t appear to have reached a level that would prompt the Fed to tighten quickly. This created an ideal backdrop for gold to recover some losses and attempt a near-term breakout.
Further pullback of the Greenback may continue to exert upward pressure on gold, which has entered a sharp correction after the Federal Reserve signaled a hawkish shift in its monetary policy at the June FOMC meeting. This puts Wednesday’s FOMC meeting minutes under the spotlight, as traders eye details of the central bank’s view on macroeconomic conditions – both inflation and the labor market - for clues about its tapering timeline.
Gold Prices vs. DXY US Dollar Index – Past 12 Months
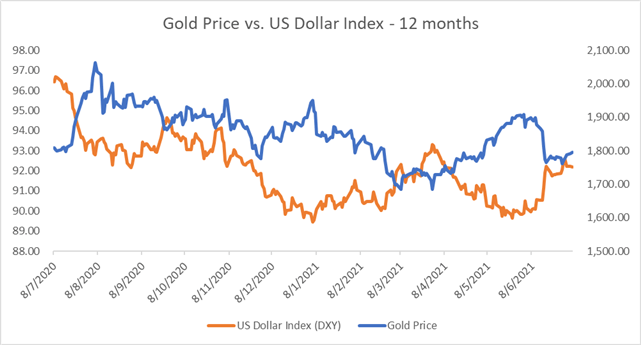
Source: Bloomberg, DailyFX
Gold Price Technical Analysis
Technically, gold prices are attempting to breach the ceiling of the range-bound zone between $1,750 -$1,795 as highlighted on the chart above. A successful attempt may open the door for further upside potential with an eye on $1,800 and then $1,809.
The MACD indicator formed a bullish crossover, suggesting that near-term selling pressure may be depleting.
| Change in | Longs | Shorts | OI |
| Daily | 1% | -3% | -1% |
| Weekly | 2% | -8% | -2% |
--- Written by Margaret Yang, Strategist for DailyFX.com
To contact Margaret, use the Comments section below or @margaretyjy on Twitter


