


S&P 500, HANG SENG INDEX, ASX 200 OUTLOOK:
- Dow Jones, S&P 500 and Nasdaq 100 indexes closed +0.44%, +0.75% and +1.15% respectively
- The US nonfarm payrolls data came in at 850k, beating expectations by a wide margin
- APAC markets are positioned to open mixed on Monday. US market is shut on Monday

Nonfarm Payrolls, Tech Rally, Yields Fall, Didi, Asia-Pacific Week-Ahead:
The S&P 500 index hit an all-time high on Friday following strong nonfarm payrolls data. Hiring accelerated in June as labor market supply constraints eased. 850k new jobs added, marking the highest reading in 10 months. May’s figure was also revised up to 583k from 559k. An upbeat payrolls figure strengthened the prospects for the US economic recovery, boosting market sentiment.
Average hourly earnings rose 0.3% MoM and 3.6% YoY, largely in line with expectations. Many companies are giving hiring bonuses as more people are asking for more in view of inflationary pressures and tight market conditions. As the data continues to point higher, economists are looking for US GDP growth in the second quarter to hit an annualized pace of 10% YoY.
This did not stoke further concerns about Fed tapering stimulus however, as the pace of job growth didn’t appear to have reached a level that would prompt the central bank to tighten quickly. The DXY US Dollar index pulling away from a three-month high and Treasury yields retreated across the curve.
US Nonfarm Payrolls – Past 12 Months
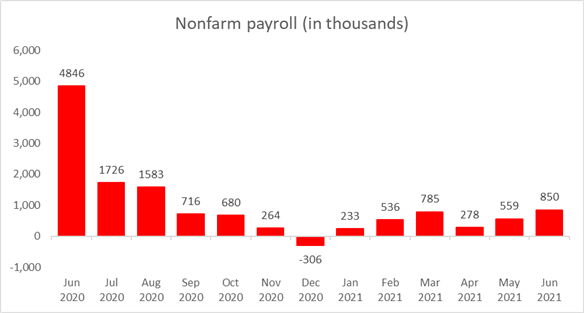
Source: Bloomberg, DailyFX
APAC markets look set to kick off the week in a mixed mood, and the closure of US markets on Monday may thin out volume. Futures were lower in Japan and mainland China while tracking higher in Australia, Hong Kong, South Korea, Taiwan, Malaysia and India.
Hong Kong’s Hang Seng Index may be in focus today after Chinese regulators ordered app stores to remove Didi Chuxing – China’s largest ride-hailing service provider - on alleged data and privacy laws violations. Didi was listed on the New York stock exchange just four days ago, raising US$4.4 billion from the US markets. This marks a step up for Beijing’s regulation of technology giants, potentially weighing on the performance of the tech sector.
For the week ahead, the RBA interest rate decision and the FOMC minutes dominate the economic docket alongside Chinese inflation data. The July OPEC+ meeting will also be under the spotlight for clues about the oil cartel’s output plan as Saudi Arabia and the United Arab Emirates seek common ground for a hike. Find out more from the DailyFX calendar.
Looking back to Friday’s close, 9 out of 11 S&P 500 sectors ended higher, with 89.2% of the index’s constituents closing in the green. Information technology (+1.39%), consumer discretionary (+1.08%) and communication services (+0.92%) outperformed, whereas financial (-0.20%) and energy (-0.20%) trailed behind.
S&P 500 Sector Performance 02-07-2021
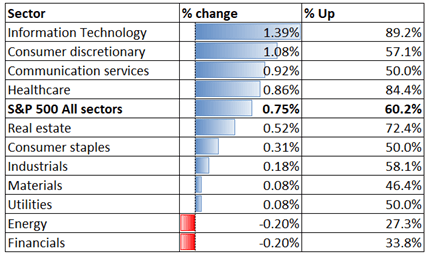
Source: Bloomberg, DailyFX
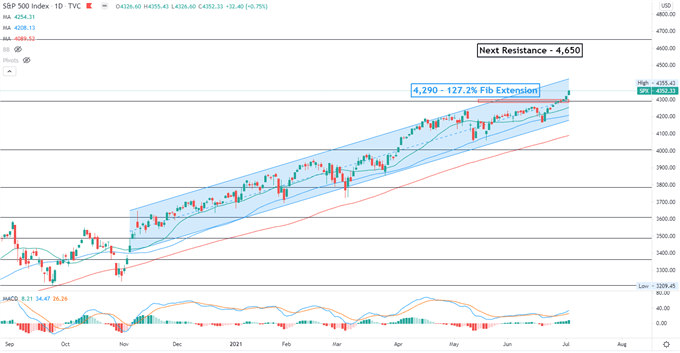
S&P 500 Index Technical Analysis
The S&P 500 index breached above a key resistance level at 4,290 and trended upward, carving a path for prices to attempt higher highs. The overall bullish trend remains intact as suggested by the “Ascending Channel”. The next resistance level can be found at 4,650 – the 161.8% Fibonacci extension. A pullback may lead to a test of the 20- and 50-day SMA lines for immediate supports.
S&P 500 Index – Daily Chart
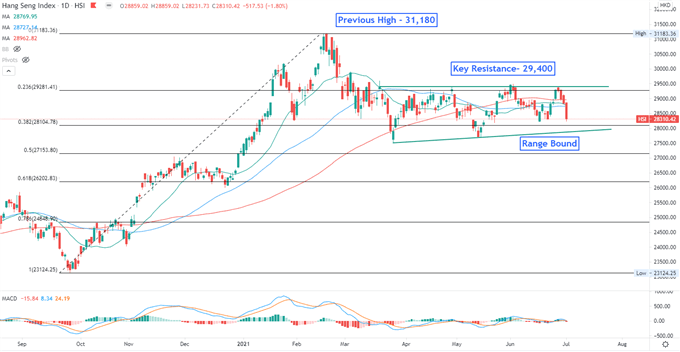
Hang Seng Index Technical Analysis:
The Hang Seng Index failed on another try to breach a key resistance at 29,400, and has since entered a correction. Prices continued to range bound in a range as highlighted on the chart below, lacking a clear direction. The MACD indicator is oscillating at around the neutral line, suggesting that momentum may be fading.
Hang Seng Index – Daily Chart
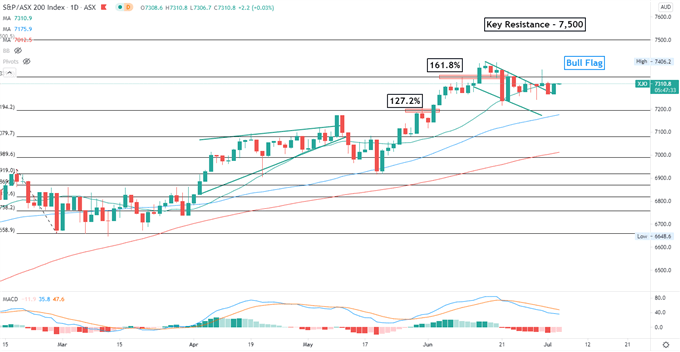
ASX 200 Index Technical Analysis:
The ASX 200 index is attempting to breach the ceiling of a “Bull Flag” chart pattern. A successful attempt may open the door for further upside potential. The overall trend remains bullish-biased, as suggested by the consecutive higher highs and higher lows. A major resistance level can be found at around 7,500. The MACD indicator formed a bearish crossover and trended lower, suggesting that further consolidation may be underway.
ASX 200 Index – Daily Chart

--- Written by Margaret Yang, Strategist for DailyFX.com
To contact Margaret, use the Comments section below or @margaretyjy on Twitter


