


S&P 500, NIKKEI 225, ASX 200 INDEX OUTLOOK:
- Dow Jones, S&P 500 and Nasdaq 100 closed +0.61%, +0.13%, and -0.12% respectively
- Investors mulled viral concerns while waiting for Friday’s US job data. Volatility stayed low
- The Hong Kong market is shut for a public holiday on Thursday

Delta Variant, Nonfarm, USD, OPEC+, Asia-Pacific at Open:
Wall Street stocks were mixed on the last trading day of June, with cyclical-oriented sectors outperforming defensive ones. Both the S&P 500 and Nasdaq 100indexes advanced for a fifth quarter in a row, marking the longest winning streak since 2018. Yet, the rapid spread of theDelta strain of Covid-19 may be casting a shadow over a fragile and uneven global recovery.
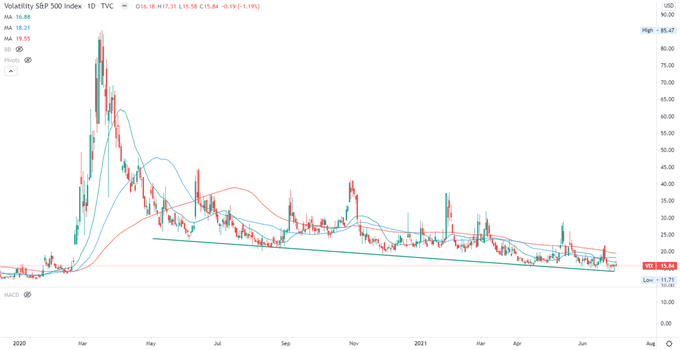
Market volatility remains subdued as the VIX index extended lower to the pre-pandemic perch (chart below). This may provide a backdrop for large price swings if Friday’s nonfarm payrolls data delivers a big surprise. Investors are anticipating 700k new jobs to be created in June, a big leap from May’s reading of 559k. A substantial beat may strengthen Fed tapering stimulus prospects and thus may lead the US Dollar higher, whereas the opposite may do the reverse.
Volatility Remains Subdued
The US Dollar index advanced to 92.37 overnight, exerting downward pressures on precious metals and emerging market currencies. Gold prices continued to consolidate at around $1,767 after breaking below the trending support of a “Bearish Pennant”. WTIis challenging a key resistance level at $73.5 ahead of today’s OPEC+ meeting, in which the oil cartel may decide a 550k bpd output hike in August to meet rising fuel demand.
Asia-Pacific markets are mixed at the beginning of Thursday’s trading session. Futures in Japan, Australia, Taiwan, Malaysia and Thailand are in the red, whereas those in mainland China, South Korea, Singapore and India are higher. The Hong Kong market is shut for the HK SRA Establishment Day.
Japan’s Nikkei 225 index continued to consolidated below the 100-day SMA line waiting for fresh catalysts. The Q2 Tankan large manufacturers index came below market expectations, which may weigh on sentiment today.
Looking ahead, a string of Eurozone and US Markit manufacturing PMI data lead the economic docket alongside initial weekly jobless claims data. Find out more from DailyFX economic calendar.
Looking back to Wednesday’s close, 6 out of 11 S&P 500 sectors ended higher, with 57.8% of the index’s constituents closing in the green. Energy (+1.31%), industrials (+0.80%) and consumer staples (+0.72%) were among the best performers, whereas real estate (-0.76%) and communication services (-0.23%) underperformed.
S&P 500 Sector Performance 30-06-2021
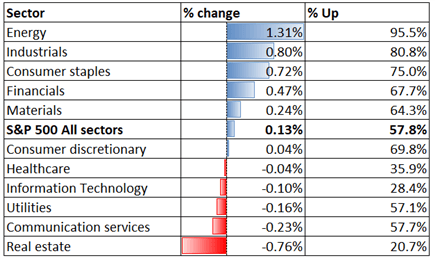
Source: Bloomberg, DailyFX

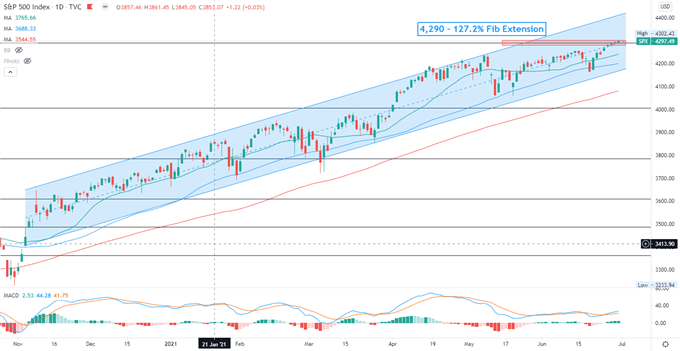
S&P 500 IndexTechnical Analysis
The S&P 500 index is challenging a key resistance level at 4,290 – the 127.2% Fibonacci extension. Breaching this level may open the door to further upside potential, whereas a failed attempt may lead to a test of the 20- and 50-day SMA lines for immediate supports. The overall trend remains bullish-biased as prices continue to trend higher within a “Ascending Channel” formed since November.
S&P 500 Index– Daily Chart
Nikkei 225 Index Technical Analysis:
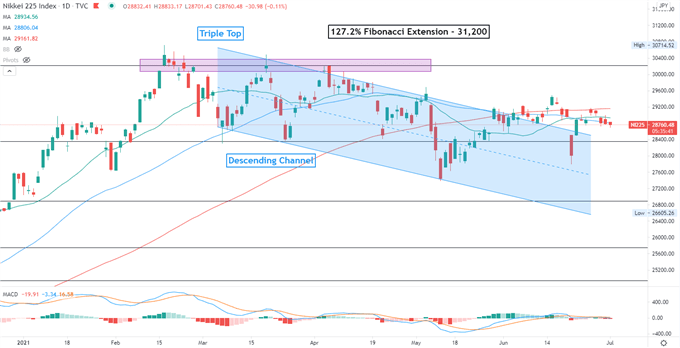
The Nikkei 225 index is attempting to breach the 100-day SMA line, which is an immediate resistance level. The index has also likely broken the ceiling of a “Descending Channel” and thus opened the door for further upside potential. The next key resistance level can be found at 30,200- the 127.2% Fibonacci extension and where the “Triple Top” resistance lies.
Nikkei 225 Index – Daily Chart
ASX 200 Index Technical Analysis:
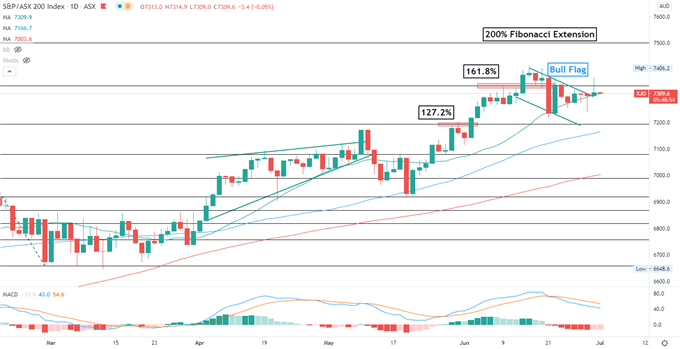
The ASX 200 index is attempting to breach the ceiling of the “Bull Flag” pattern, which hints at further upside potential after a period of consolidation. A successful attempt may open the door for further gains with an eye on 7,340 – the 161.8% Fibonacci extension. Immediate support levels can be found at the 20-day SMA line (7,310) and then 7,200 – the 127.2% Fibonacci extension. The overall bullish trend remains intact as suggested by the upward-sloped SMA lines.
ASX 200 Index – Daily Chart

--- Written by Margaret Yang, Strategist for DailyFX.com
To contact Margaret, use the Comments section below or @margaretyjy on Twitter


