


S&P 500, HANG SENG, ASX 200 INDEX OUTLOOK:
- Dow Jones, S&P 500 and Nasdaq 100 closed -0.21%, -0.11%, and +0.03% respectively
- Dallas and Atlanta Fed Presidents both signalled that tapering stimulus may come sooner than expected, according to Bloomberg
- More than 60% of the S&P 500 constituents ended lower, setting a sour tone for the APAC markets

Tapering debate, Yields, Markit Manufacturing PMI, Oil, Asia-Pacific at Open:
Wall Street stocks pulled back slightly as investors mulled tapering concerns after both Dallas Fed President Robert Kaplan and Atlanta Fed President Raphael Bostic gave hawkish-biased signals. Kaplan said that the economy will likely meet the central bank’s threshold for tapering asset purchases sooner than people had anticipated. An upbeat Markit manufacturing PMI reading strengthened this view, with the gauge showing manufacturing activity expanding at the fastest pace since 2007 (chart below). Bostic said the central bank could decide to scale back bond purchases in the next few month, echoing St. Louis Fed President James Bullard’s hawkish-biased comments last Friday.
Markit US Manufacturing PMI – at the Highest Since 2007
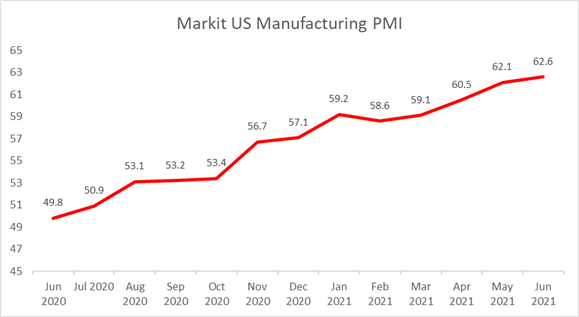
Source: Bloomberg, DailyFX
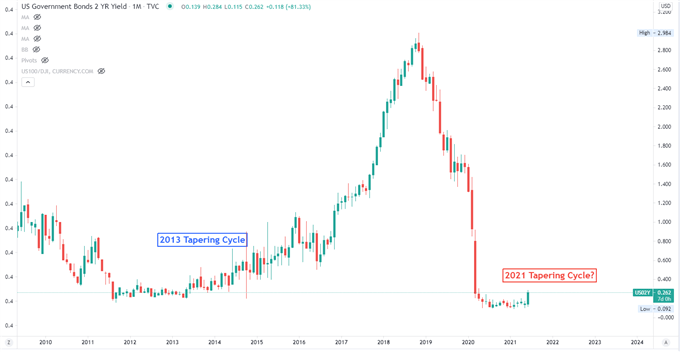
As a result, 2-year Treasury yields closed at a 14-month high of 0.262% on Wednesday, reflecting that investors are pricing in earlier rate hikes and tapering Fed stimulus. Looking back into the previous monetary cycle, a rapid climb in 2-year rates was followed by the Fed’s decision to end QE and raise interest rates. Should the economy continue to blossom, the front-end yields may have more room to climb. This may weigh on equity valuations because their future cashflows are discounting back at higher required rate of returns. Highly leveraged aviation, real estate and some technology firms may be more vulnerable to the headwind.
US 2-Year Treasury Yield – Monthly Chart
Asia-Pacific markets look set to open broadly lower on Thursday. Futures in Japan, Australia, Hong Kong, Taiwan, Singapore, Malaysia, India and Thailand are in the red, whereas those in mainland China and South Korea are slightly higher.
Hong Kong’s Hang Seng Index (HSI) looks set test an immediate resistance level of 28,920 today. A failed attempt to breach this level may pave the way for further consolidation. The US government is planning to ban solar products made in the Xinjiang province, which may escalate geopolitical tensions between the world’s two largest economies. Tightening prospect of the Fed’s monetary policy may also weigh on sentiment, especially for the technology, real estate and aviation sectors.
Looking ahead, the BoE interest rate decision leads the economic docket alongside US durable goods orders and initial weekly jobless claims data. Find out more from DailyFX economic calendar.
Looking back to Wednesday’s close, 8 out of 11 S&P 500 sectors ended lower, with 60.2% of the index’s constituents closing in the red. Utilities (-1.05%), materials (-0.62%) and consumer staples (-0.57%) were among the worst performers, whereas consumer discretionary (+0.63%) and financials (+0.27%) outperformed.
S&P 500 Sector Performance 23-10-2021
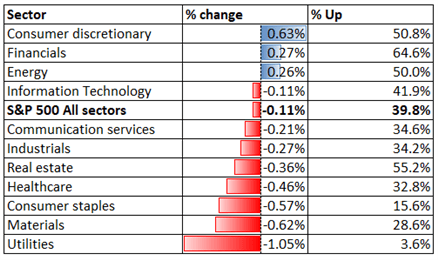
Source: Bloomberg, DailyFX

S&P 500 IndexTechnical Analysis
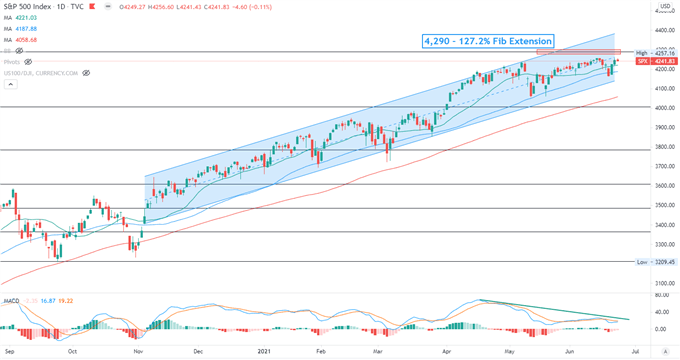
The S&P 500 index is extending higher within an “Ascending Channel” formed since November. The overall bullish trend remains intact, but prices may be facing some pressure at around 4,290 – the 127.2% Fibonacci extension. Bearish MACD divergence hints that upward momentum may be fading as the index shows reluctancy to move decisively higher. A pullback may lead to a test of the 20- and 50-day SMA lines for immediate supports.
S&P 500 Index– Daily Chart
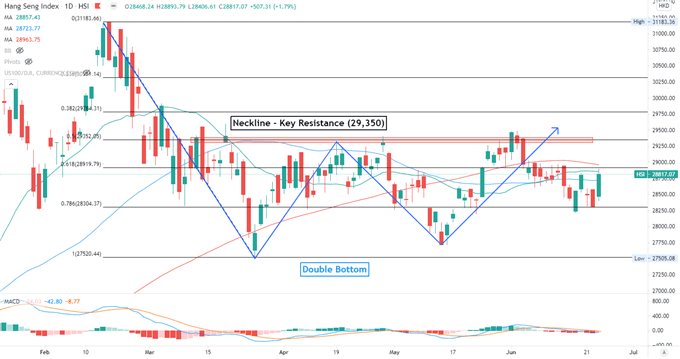
Hang Seng Index Technical Analysis:
The Hang Seng Index failed to breach the neckline of the “Double Bottom” pattern and has since entered a technical pullback. Prices may continue to range bound between 28,300 and 29,350 waiting for fresh catalyst. Breaching below 28,300 may lead to further losses with an eye on 27,600 for support. The MACD indicator is trending lower, suggesting that momentum may be tilted to the downside.
Hang Seng Index – Daily Chart
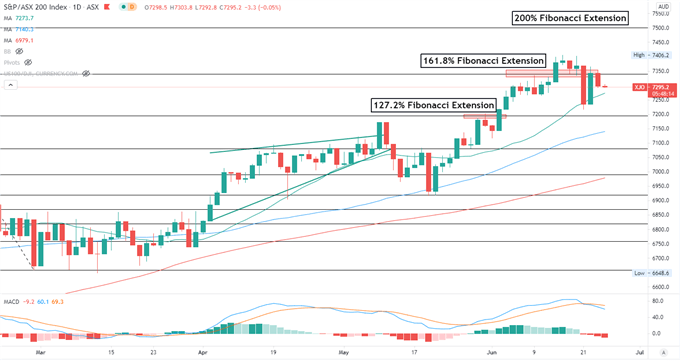
ASX 200 Index Technical Analysis:
The ASX 200 index pulled back from the 161.8% Fibonacci extension level of 7,340 and may see further price weakness. The MACD indicator formed a bearish crossover and trended lower, suggesting near-term momentum may be tilted to the downside. The 20-day SMA line may serve as an immediate support, beaching which may open the door for further losses with an eye on the 127.2% Fibonacci level for support.
ASX 200 Index – Daily Chart

--- Written by Margaret Yang, Strategist for DailyFX.com
To contact Margaret, use the Comments section below or @margaretyjy on Twitter


