


Gold Price Forecast:
- Gold has retreated to support ahead of a crucial FOMC meeting that could spark price volatility
- Gold bulls will need to avoid further taper talk that could spark a USD rally and cripple gold gains
- Bitcoin vs Gold: Top Differences Traders Should Know
Gold Price Retreats to Support Ahead of Pivotal FOMC Meeting
Gold prices ticked lower to start the week as traders anxiously await the looming Federal Open Market Committee meeting due Wednesday. The event, which has been lauded as the top event risk of the month by many, possesses the potential to spark considerable market volatility and upend recent price trends. Gold may be exceedingly vulnerable to post-FOMC price movements as Treasury yields and the US Dollar have longstanding influence over the precious metal.
Gold Price Chart Posts Bullish "Golden Cross" Formation, Will it Rally?
As a result, the bullish technical formation gold enjoys could unravel should the Fed reveal a hawkish lean. The “golden cross” formation gold posted last week is the most recent sign of potential gains in the future, but gold’s price action in the week thus far suggests the recovery rally that began in late March could be in peril.
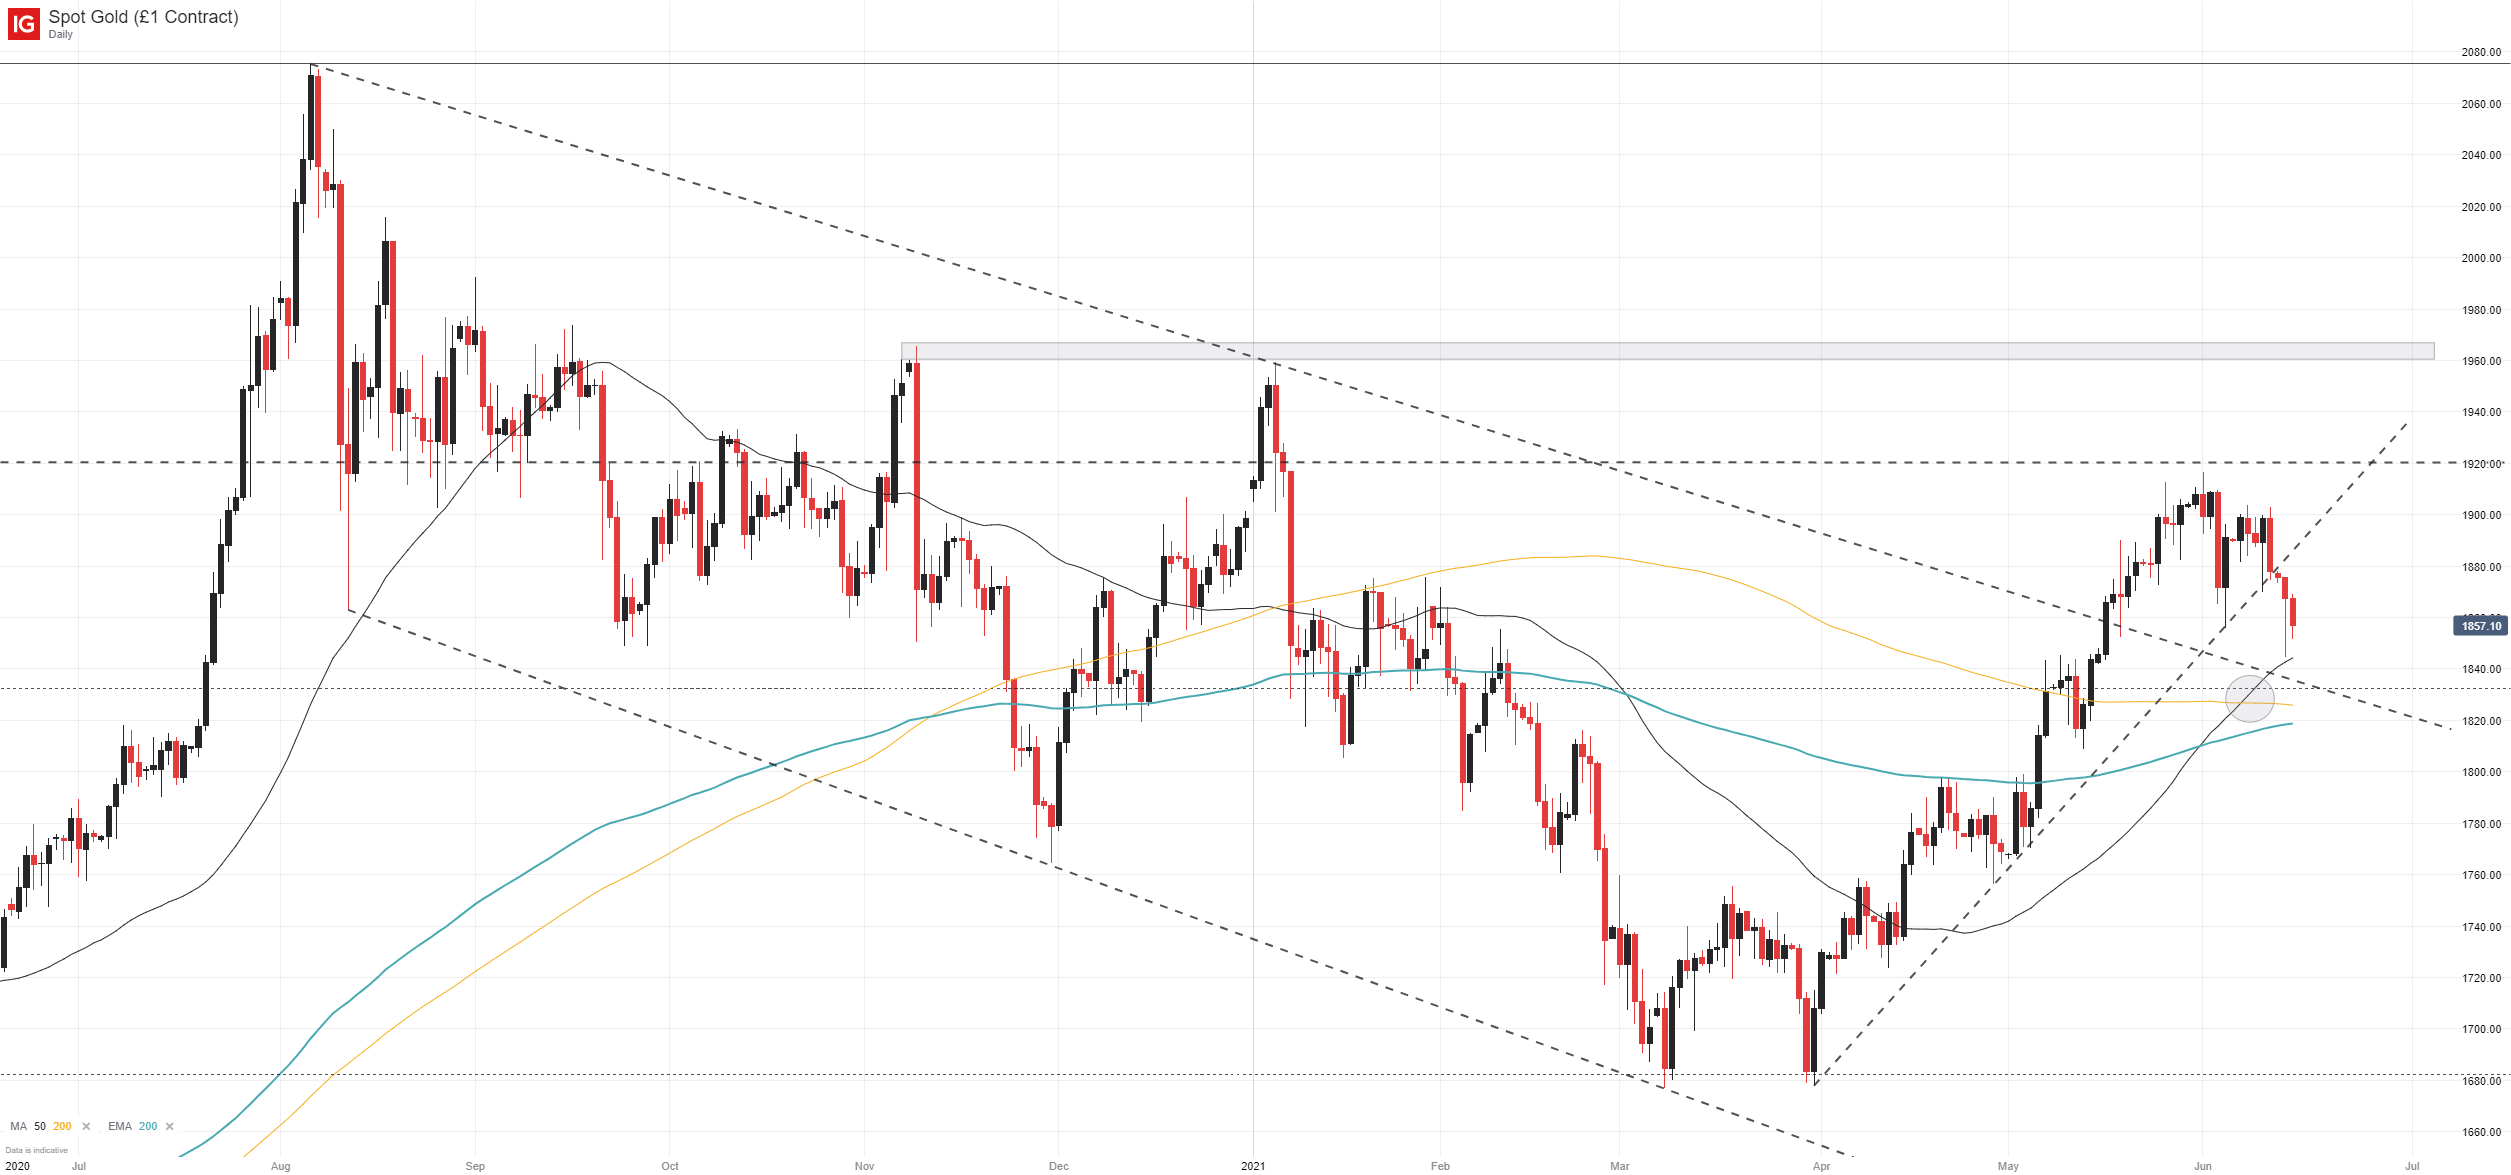
Gold (XAU/USD) Price Chart: Daily Time Frame (July 2020 - June 2021)
How to Trade Gold: Top Gold Trading Strategies and Tips
To that end, the line in the sand for gold’s recovery rally likely stands around the $1,850 area. Adjacent to the descending trendline that support is originally derived from is the metal’s 50-day simple moving average (SMA), its 200-day SMA and a Fibonacci level. Together, the various technical markers create an area of considerable support that, if broken, would constitute a significant shift in the technical outlook.

With that in mind, all eyes turn to the upcoming FOMC meeting at which the central bank will offer crucial insight on their projected policy path, inflation expectations and economic forecasts. Should market sentiment shift or the Fed change its policy path, gold’s recent recovery rally could come to an end if price slips back into the descending channel from August. Until such a breakdown occurs, however, longer-term strength remains a possibility. In the meantime, follow @PeterHanksFX on Twitter for updates and analysis.
--Written by Peter Hanks, Strategist for DailyFX.com
Contact and follow Peter on Twitter @PeterHanksFX


