


GOLD PRICE OUTLOOK:
- Gold prices climbed to a four-month high, challenging psychological resistance of $ 1,900
- A weaker US Dollar, inflation concerns and extreme volatility in cryptocurrencies have likely boosted the precious metal
- The world’s largest gold ETF saw accelerated inflows in May as prices rose, Chinese buyers returned

Gold prices edged higher during Monday’s Asia-Pacific trade, reaching a four-month high of $ 1,887 before pulling back slightly. Stronger-than-expected US manufacturing and service PMI data released on Friday boosted the inflation outlook and thus bolstered the appeal of precious metals perceived as an inflation-hedge. Meanwhile, the DXY US Dollar index is hovering near a three-month low of 90.02, lending support to the yellow metal.
Extreme volatility in the Bitcoin-led cryptocurrencies encouraged traders to look again at gold as capital flows sought safety and stability. Investors weighed uncertainties and risks in trading the digital tokens amid doubts surrounding Main Street adoption and regulatory headwinds. Gold offers an alternative to cryptocurrencies for investors who are looking for assets that are non-fiat and therefore cannot be diluted by central bank easing.
The return of Chinese buyers lent further support to bullion prices after regulators eased import quotas to meet domestic demand. Chinese non-monetary gold imports surged to111.9 tons in April, an almost three-fold rise from March’s 38.58 tons (chart below). Rising demand from China may help to offset a decline from India, which is struggling to recover from a wave of Covid-19 outbreaks.
China Non-Monetary Gold Total Imports - Monthly
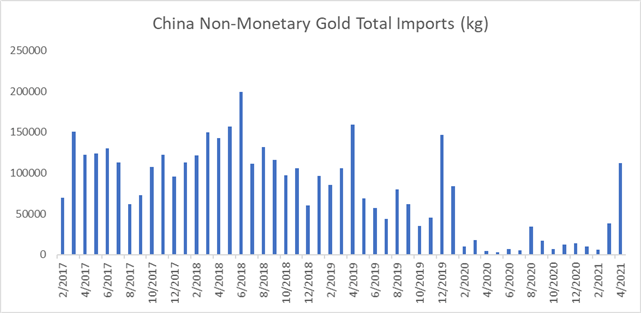
Source: Bloomberg, DailyFX
Looking ahead, this Friday’s US core PCE inflation data will be closely monitored by traders for clues about rising prices levels and their ramifications for the economy as well as the Fed. Core PCE data is a key inflation gauge that the Federal Reserve uses to determine monetary policy. April’s reading is expected to come in at 3.0% - the highest level since 1992 - partially due to a low-base effect. A higher-than-expected print may intensify inflation fears and drive market volatility.
The world’s largest gold ETF - SPDR Gold Trust (GLD) – saw three consecutive weeks of net inflow in May. This suggests that more buyers are returning to the bullion market after months of selling. The number of GLD shares outstanding increased 5.0 million last week, after climbing 3.7 and 2.5 million in the prior two weeks respectively. Gold prices and the number of outstanding GLD shares have exhibited a strong positive correlation in the past (chart below). Therefore, an accelerated pace of subscription to the ETF may be viewed as a bullish signal for prices.
Gold Price vs. GLD ETF Shares Outstanding – 12 Months
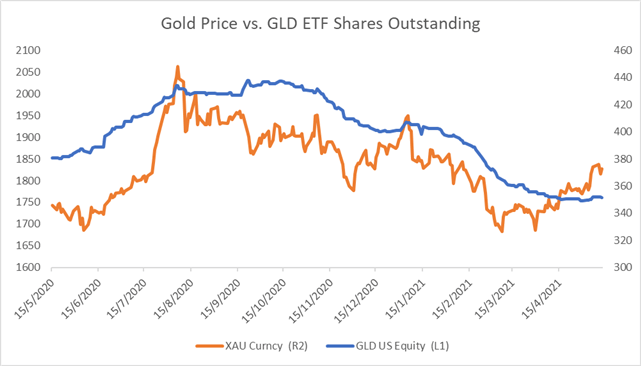
Source: Bloomberg, DailyFX
Technically, gold prices extended higher within an “Ascending Channel” after completing a “Double Bottom” chart pattern. The ceiling and the floor of the “Ascending Channel” may be viewed as immediate resistance and support levels respectively. Prices pierced through a key resistance level at $ 1,875 (the 50% Fibonacci retracement) and have likely opened the door for further upside potential with an eye on $ 1,922 (the 61.8% Fibonacci retracement).
The MACD indicator is trending higher above the neutral midpoint, underscoring upward momentum.
Gold Price – Daily Chart
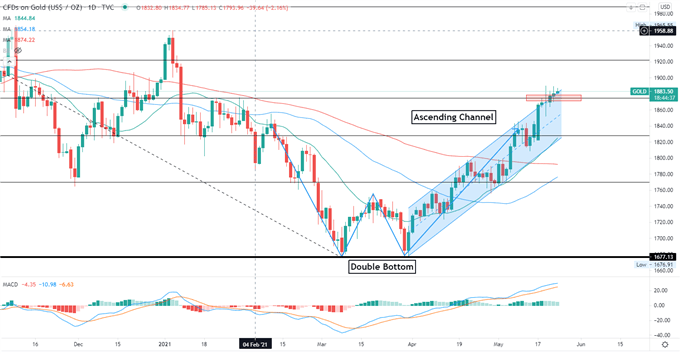
Chart by TradingView
| Change in | Longs | Shorts | OI |
| Daily | 4% | 1% | 3% |
| Weekly | -8% | 4% | -3% |
--- Written by Margaret Yang, Strategist for DailyFX.com
To contact Margaret, use the Comments section below or @margaretyjy on Twitter


