


DOW JONES, NIKKEI 225, ASX 200 WEEKLY OUTLOOK:
- Dow Jones, S&P 500 and Nasdaq 100 closed +0.89%, +0.77%, and +0.51% respectively
- US earnings season is kicking off this week, with JP Morgan, Goldman Sachs, Wells Fargo and Bank of America among the pioneers to announce Q1 results
- The Nikkei 225 and ASX 200 index traded mildly higher; yields climbed on strong PPI readings
| Change in | Longs | Shorts | OI |
| Daily | 1% | -1% | 0% |
| Weekly | 15% | -13% | -1% |
Earnings, Inflation, Yields, Asia-Pacific Week-Ahead:
Wall Street equities extended higher on Friday, with the Dow Jones and the S&P 500 both hitting fresh records. Strong macro data and stimulus-led reflation hopes alongside the Fed’s accommodative stance boosted investor confidence. A slew of bank earnings this week are expected to provide clues about the pace of economic recovery.
Based on data from Factset, the estimated Q1 earnings growth rate for the S&P 500 is 24.5% YoY, which will mark the highest since Q3 2018. More companies have issued positive EPS guidance than those that have issued a negative outlook, suggesting that corporates are more optimistic about their business with rapid rollout of vaccines and eased lockdown measures. Industrial analysts foresee a 10% price increase in the S&P 500 index over the next 12 months based on bottom-up analysis.
Inflation remains a key market focus, with higher-than-expected Chinese and US PPI readings leading Treasury yields higher on Friday. China’s March PPI rate jumped 4.4% YoY, compared to a 3.5% forecast. Rising price levels of goods at factory doors may bring up consumer price levels in the months to come, which may solidify the PBoC’s neutral monetary policy stance. US March PPI climbed 1.0% MoM, beating the forecast by half of a percent and hinting at a faster-than-expected rise in output prices.
US Q1 Earnings Highlights

Source: Bloomberg, DailyFX
Asia-Pacific markets look set to kick off the week in a positive mood, with futures across Japan, Australia, Hong Kong, Taiwan, Singapore, Malaysia, India and Thailand pointing to a higher start following a record close on Wall Street. The VIX volatility index fell to its lowest level seen since February 2020, suggesting that markets are probably in a complacent mood again.
The MSCI emerging market index has underperformed the MSCI developed market index since Greater China equities entered a consolidative phase in mid-February. Chinese authorities fined AlibabaGroup $2.8 billion in a monopoly probe, which may signal a further tightening up in regulatory control on the technology giants. This move may dampen sentiment across Greater China markets, leading to further divergence between the performance of EM and DM markets.
Looking ahead, Tuesday’s US core inflation and Thursday’s US retail sales data are among the top event risks this week. China will report its Q1 GDP growth rate on Friday, which is expected to hit 18.8% YoY partly due to a low base in the previous year. Meanwhile, oil traders will eye Wednesday’s API crude inventory data for clues about the supply and demand relationship. The RBNZ will announce its policy interest rate decision on Wednesday too. Find out more from the DailyFX calendar.
Looking back to Friday’s close, 6 out of 9 Dow Jones sectors ended higher, with 73.3% of the index’s constituents closing in the green. Healthcare (+1.48%), information technology (+1.47%) and consumer discretionary (+1.15%) were among the best performers, while consumer staples (-0.36%) and energy (-0.10%) lagged behind.
Dow Jones Sector Performance 09-04-2021
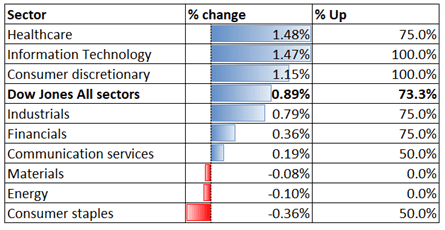
Source: Bloomberg, DailyFX

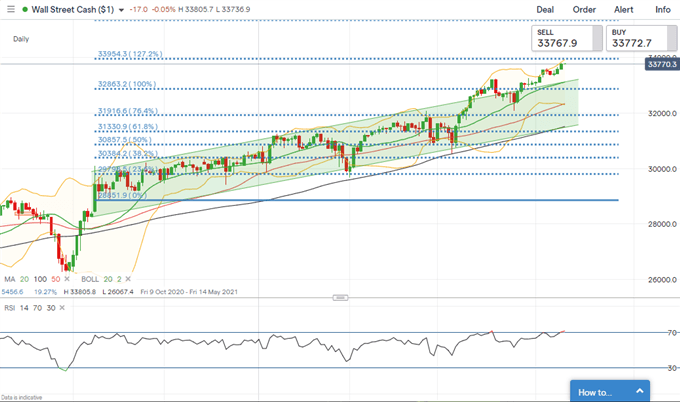
Dow Jones Index Technical Analysis
The Dow Jones indexbroke above the ceiling of the “Ascending Channel” and extended higher, underscoring strong upward momentum. The index is attempting to test an immediate resistance level at 33,954 - the 127.2% Fibonacci extension. A successful attempt would likely intensify near-term buying pressure and expose the next resistance level of 35,348 (the 161.8% Fibonacci extension). The RSI indicator breached above the overbought threshold of 70.0, suggesting that the index may be temporarily overstretched and further advancement may lead to a pullback.
Dow Jones Index – Daily Chart
Nikkei 225 Index Technical Analysis:
The Nikkei 225 index failed to breach the 30,214 resistance (the 127.2% Fibonacci extension) for a third attempt, potentially forming a “Triple Top” chart pattern. Immediate support levels can be found at 29,516 ( 20-day SMA), 29,372 (50-day SMA) and then 28,357 (100% Fibonacci extension). The MACD indicator is trending lower, suggesting that further consolidation is likely.
Nikkei 225 Index – Daily Chart
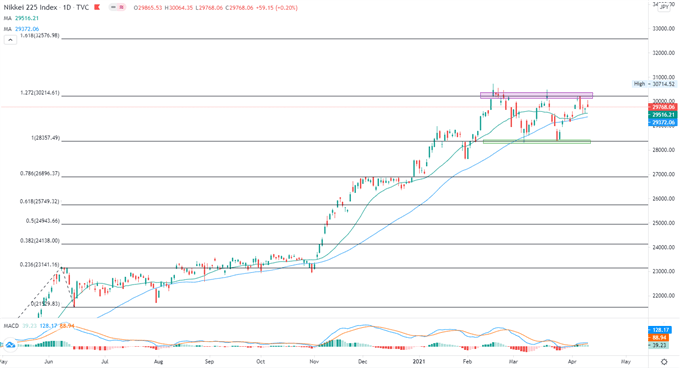
Chart by TradingView
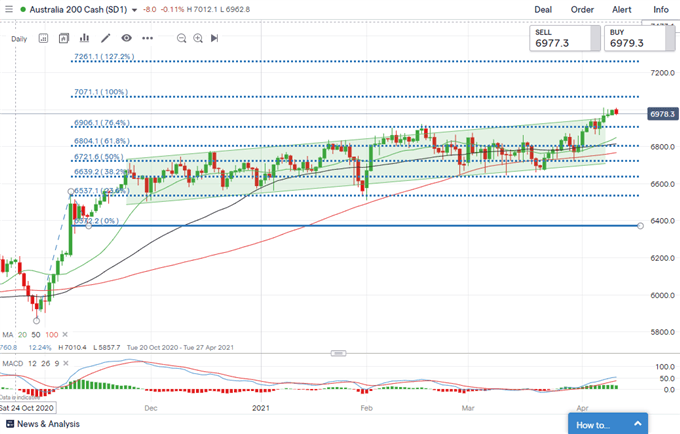
ASX 200 Index Technical Analysis:
The ASX 200 index breached above the ceiling of the “Ascending Channel” and moved forward to test a psychological resistance at 7,000. A daily close above 7,000 would likely intensify near-term buying pressure and pave the way for further upside potential towards 7,071 – the 100% Fibonacci extension. The MACD indicator is trending higher above the neutral midpoint, suggesting that buying pressure is building up.
ASX 200 Index – Daily Chart

--- Written by Margaret Yang, Strategist for DailyFX.com
To contact Margaret, use the Comments section below or @margaretyjy on Twitter


