


Nasdaq 100 Price Outlook:
- The Nasdaq 100 snapped its month-long downtrend in mid-March and has since reversed higher
- An encouraging fundamental backdrop may serve as a tailwind for further gains
- Nasdaq Trading Basics: How to Trade Nasdaq 100
Nasdaq 100 Forecast: Are New Highs Ahead?
The Nasdaq 100 suffered a month of turbulence as rising Treasury yields pressured many of the high-flying technology stocks that have dragged the broader index higher since March 2020. A recent pause in Treasury yield gains has seen tech stocks regain their footing and, further still, encouraging economic data across the board has bolstered the fundamental argument for US equity exposure.

While yields may continue to tick higher in the future as a byproduct of the considerable growth the United States economy is expected to experience, the Nasdaq 100 may press higher regardless. Further still, recent gains have seen the tech-heavy index snap the downtrend that began in mid-February and reclaim its 50-day simple moving average. It could also be argued the contraction created a bull flag formation, a trading pattern that typically precedes a continuation higher.
Nasdaq 100 Price Chart: Daily Time Frame (March 2020 – April 2021)
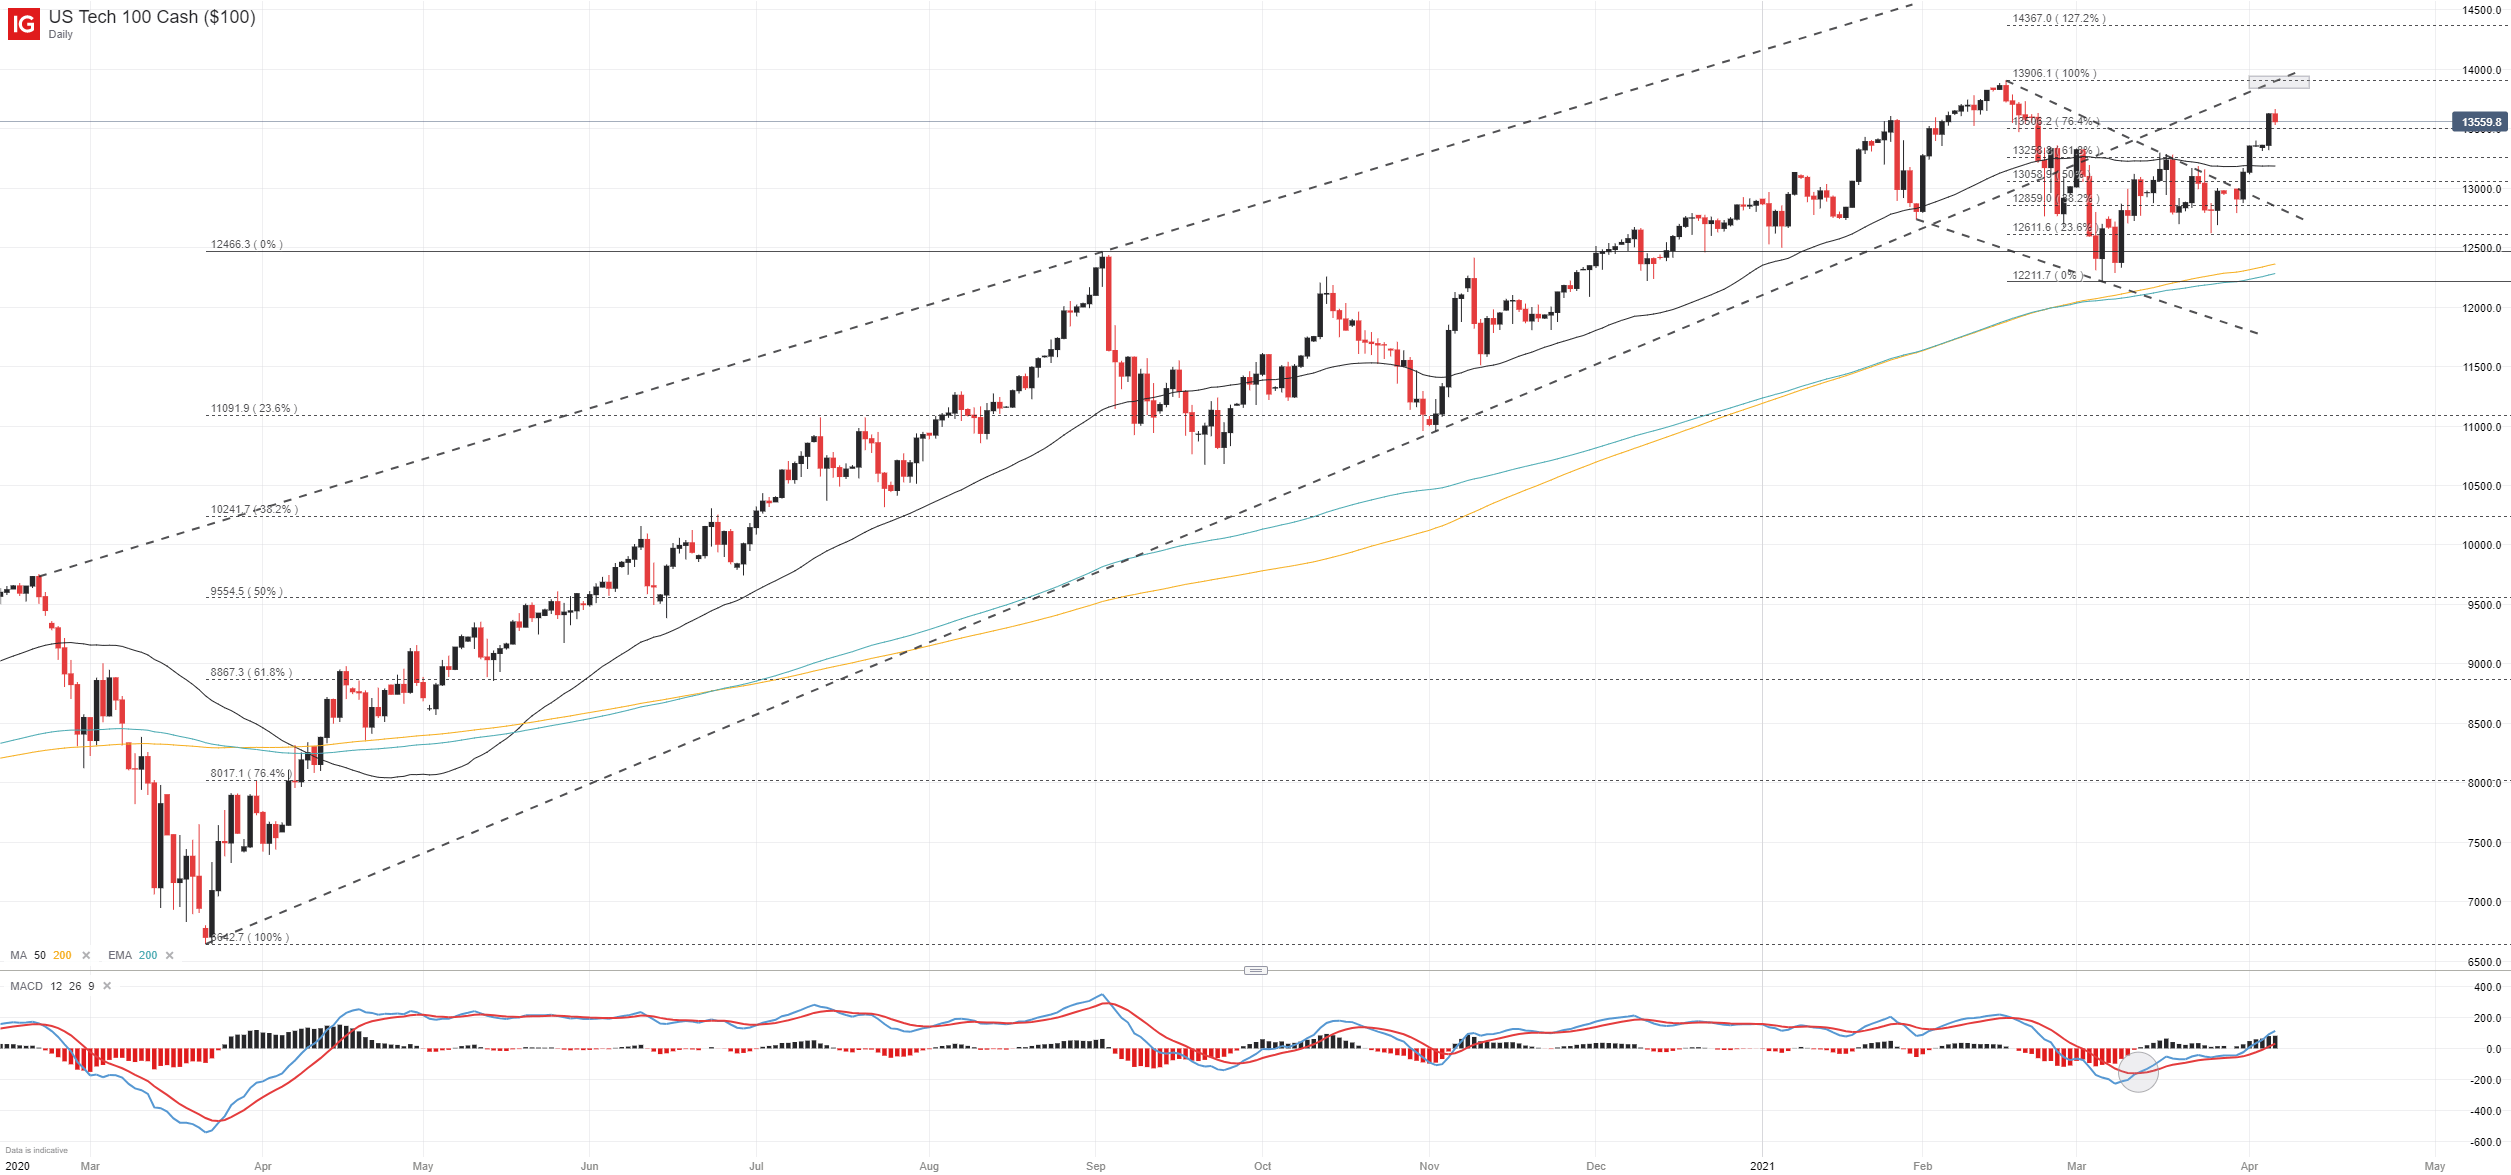
The improving technical picture and encouraging fundamental backdrop align with seasonal trends that generally favor equity strength, creating a bullish outlook for the Nasdaq 100. Should gains continue, initial resistance may reside near the index’s prior all-time high around 13,900. The level coincidentally intersects a longstanding trendline from the March 2020 lows which had helped guide the index higher until it suffered a break beneath in mid-February 2021.
Nasdaq 100 Price Chart: 1 - Hour Time Frame (February 2021 – April 2021)
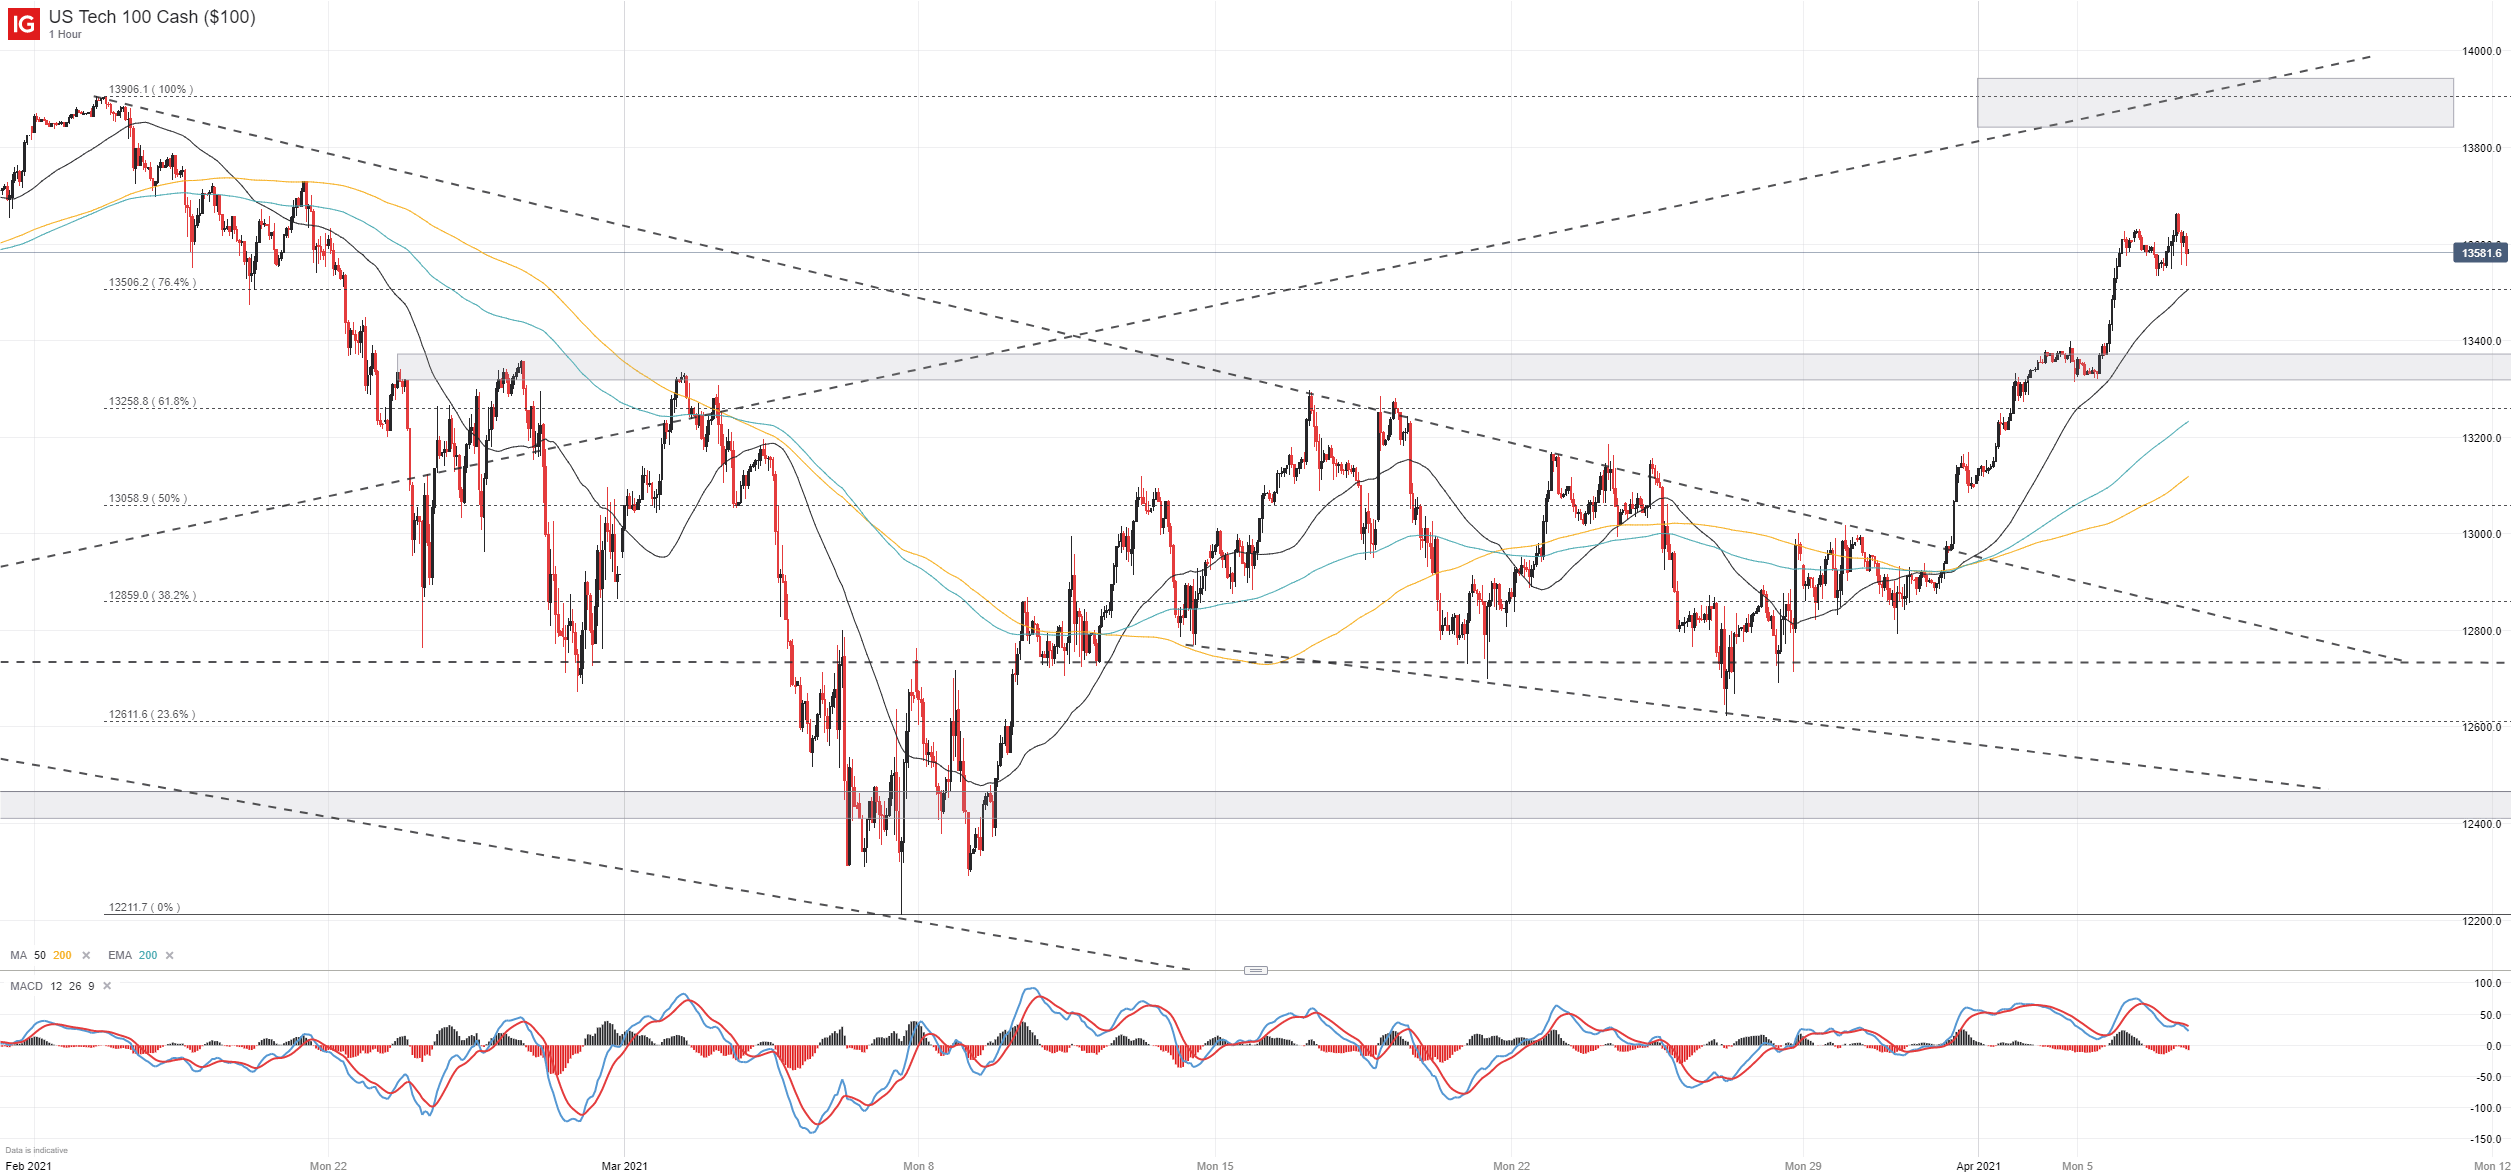
Going forward, the trendline will likely act as resistance until the Nasdaq 100 can retake the level, which may give pause to the breakout rally enjoyed over the last few sessions. If a retracement materializes, early support likely rests along the Fibonacci level at 13,506 with secondary, and perhaps more formidable, support slightly lower from 13,370 to 13,315.

The area kept the Nasdaq 100 contained throughout late February and March and gave rise to indecision in early April before finally succumbing to bullish pressure. With the zone in the rearview, the Nasdaq can look to press higher and may enjoy support from the level going forward.
--Written by Peter Hanks, Strategist for DailyFX.com
Contact and follow Peter on Twitter @PeterHanksFX


