


USD/JPY ANALYSIS
- Rise in U.S. Treasury yields backing U.S. Dollar
- Archegos Capital saga prompts investor caution
- USD/JPY technical set-ups at key junctures
- IG Client Sentiment (IGCS) bearish
JAPANESE YEN FUNDAMENTAL BACKDROP
The U.S. Dollar rose yesterday across majors driven by higher U.S. Treasury yields as well as the flight to Dollar safety after Archegos Capital made headline news. This pushed USD/JPY into unchartered territory for 2021 as bulls continue their strong push higher.
The USD/JPY FX poll (see chart below) is quite interesting in that analysts predicted a median price of 103.85 with a “smart” mean at 103.50 which places more weighting to the more accurate analysts. This is clearly quite far away from currently levels but the overall downward trajectory toward the end of 2021 may be something to keep in mind – this aligns well with the technical set-ups below.

Chart prepared by Warren Venketas, Refinitiv
USD/JPY ECONOMIC CALENDAR
Attention will be on NFP data on Friday but the rest of the week is riddled with high impact events (U.S. specific). Eyes will be on President Biden’s speech tomorrow regarding funding of the $3 - $4 trillion infrastructure plan. These events should result in significant volatility pre and post-announcements so ensuring sound risk management technique is essential.

Source: DailyFX Economic Calendar

USD/JPY TECHNICAL ANALYSIS

USD/JPY Weekly Chart:
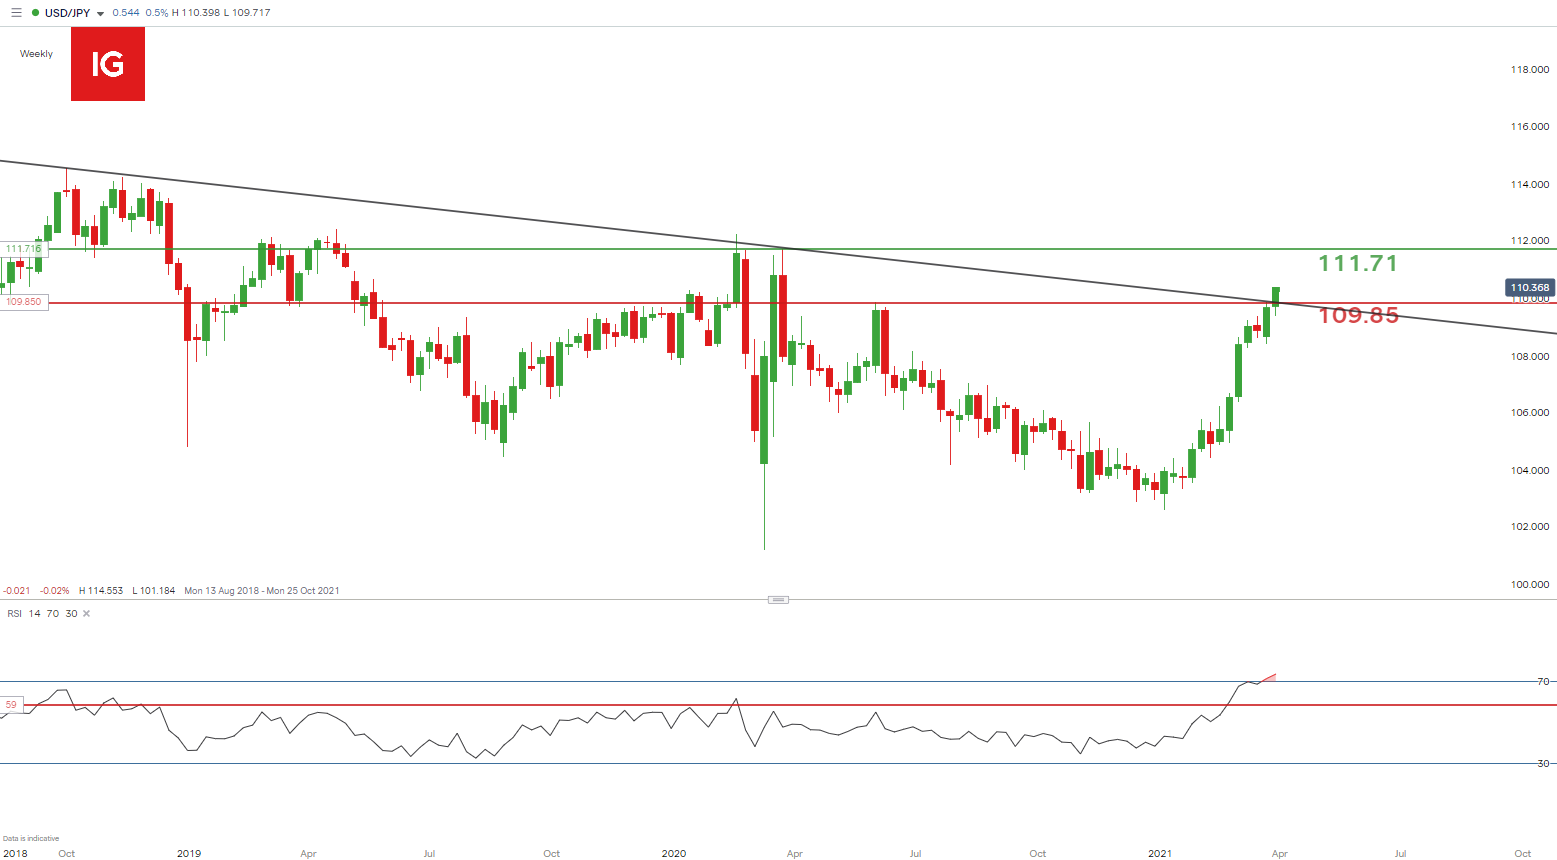
Chart prepared by Warren Venketas, IG
Year-to-date the U.S. Dollar has appreciated 6.85% against the Yen with U.S. treasury yields being the primary contributor. The weekly chart above shows price action pushing above the long-term resistance trendline (black) and consequently the June 2020 high. The breach of the 110.00 psychological level has not been present since March 2020. This being said, the Relative Strength Index (RSI) is in overbought territory which may suggest a potential price reversal to the downside. This would bring the 109.85 support zone back into focus. From the bullish perspective, the March 2020 high at 111.71 would serve as initial resistance.
The weekly candle close should be a good indicator of the short-term directional bias that is, should the candle close below trendline resistance (which coincides with the June 2020 high) then the recent upside move could be coming to an end. The opposite should ensue should the candle close above these levels, and further room for a bullish run may follow.
USD/JPY Daily Chart:
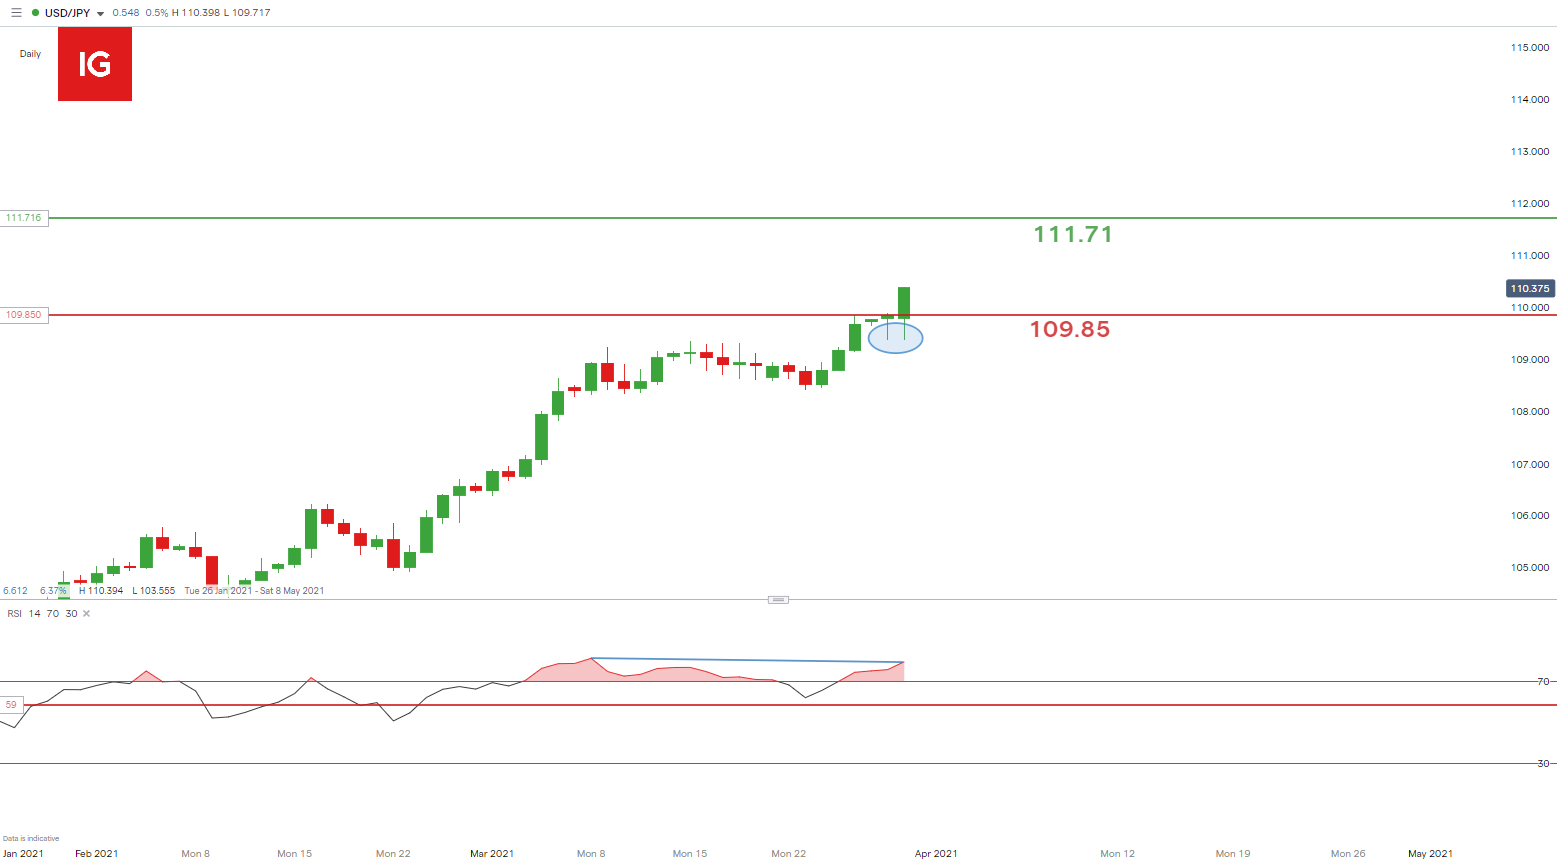
Chart prepared by Warren Venketas, IG
Looking at the shorter time frame daily chart, it is evident from the long lower candle wicks (yesterday and today) there is price rejection around the 109.37 level (blue). This could point to further upside however, the RSI indicates bearish divergence as prices are rising while the momentum indicator is relatively slower. This may lead to a short-term reversal which could test the 109.85 support followed by the 109.37 price rejection zone.
Key technical points to consider:
- 111.71 resistance target
- 109.85 support target
- RSI bearish divergence
IG CLIENT SENTIMENT SUPPORTIVE OF BEARISH REVERSAL
| Change in | Longs | Shorts | OI |
| Daily | -2% | 2% | 0% |
| Weekly | 12% | -16% | -6% |
IGCS shows retail traders are currently net long on USD/JPY, with 43% of traders currently holding long positions (as of this writing) however, traders are further net-long than yesterday and last week, and the combination of current sentiment and recent changes gives us a stronger USD/JPY bearish contrarian trading bias.
--- Written by Warren Venketas for DailyFX.com
Contact and follow Warren on Twitter: @WVenketas


