GOLD FORECAST: XAU/USD PRICE ACTION STILL STRUGGLING AMID STRONG US DOLLAR
- Gold outlook remains downtrodden for the short-term as lower lows come into focus
- XAU/USD price action continues to face headwinds largely owing to US Dollar strength
- Sharpen your technical analysis skills or check out these top gold trading strategies !
Gold prices have weathered sustained selling pressure since the precious metal peaked 7-months ago. XAU/USD price action now trades roughly -16% off its record close with weakness largely mirroring the ongoing upswing in real yields. This has corresponded with a notably stronger US Dollar, which in turn, has weighed negatively on the direction of gold. That said, and in light of the US Dollar recently extending to four-month highs, there could be potential for gold price action to face further downside.


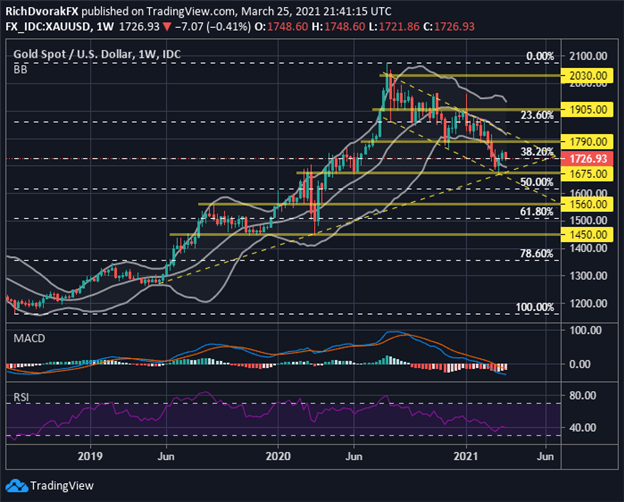
XAU/USD – GOLD PRICE CHART: WEEKLY TIME FRAME (JULY 2018 TO MARCH 2021)

Chart by @RichDvorakFX created using TradingView
XAU/USD currently oscillates around the $1,725-price level and week-to-date lows. This is a big area of technical confluence underpinned by the 38.2% Fibonacci retracement of its 2018 low to 2020 high. If gold bulls fail to defend this level and last week’s lows are taken out, that could open up the door to another stretch of weakness.
Gold bears might try to test technical support around $1,675 under this scenario. Although, the bullish long-term trendline connecting the May 2019 and March 2020 swing lows stands out as a formidable barrier with potential to stymie gold selling pressure. The bottom Bollinger Band, in addition to the broader bull flag chart pattern, could help keep gold price action afloat as well. If recent US Dollar strength subsides, however, gold bulls might make a heartier rebound attempt. It already appears that downward momentum has waned judging by the MACD indicator.
| Change in | Longs | Shorts | OI |
| Daily | 1% | -3% | -1% |
| Weekly | 2% | -8% | -2% |
Not to mention, the relative strength index shows XAU/USD is just a stone’s throw away from ‘oversold’ territory. This brings to focus potential for an eventual reversal higher. If gold can catch a bid and eclipse last week’s high, it could open up the door for a push toward the $1,790-price level. Notching a weekly close above the 20-week simple moving average, perhaps coinciding with a topside breakout from its descending channel, might signal precious metal bulls are wrestling back control.
-- Written by Rich Dvorak, Analyst for DailyFX.com
Connect with @RichDvorakFX on Twitter for real-time market insight


