


Gold Price Forecast:
- Gold suffered a significant breakdown over the last two weeks as it fell more than 7%
- The severity of the selloff saw gold wade into oversold territory and a recovery rally has followed suit
- Bitcoin vs Gold: Top Differences Traders Should Know
Gold Price Eyes Recovery After Cratering To Trendline Support
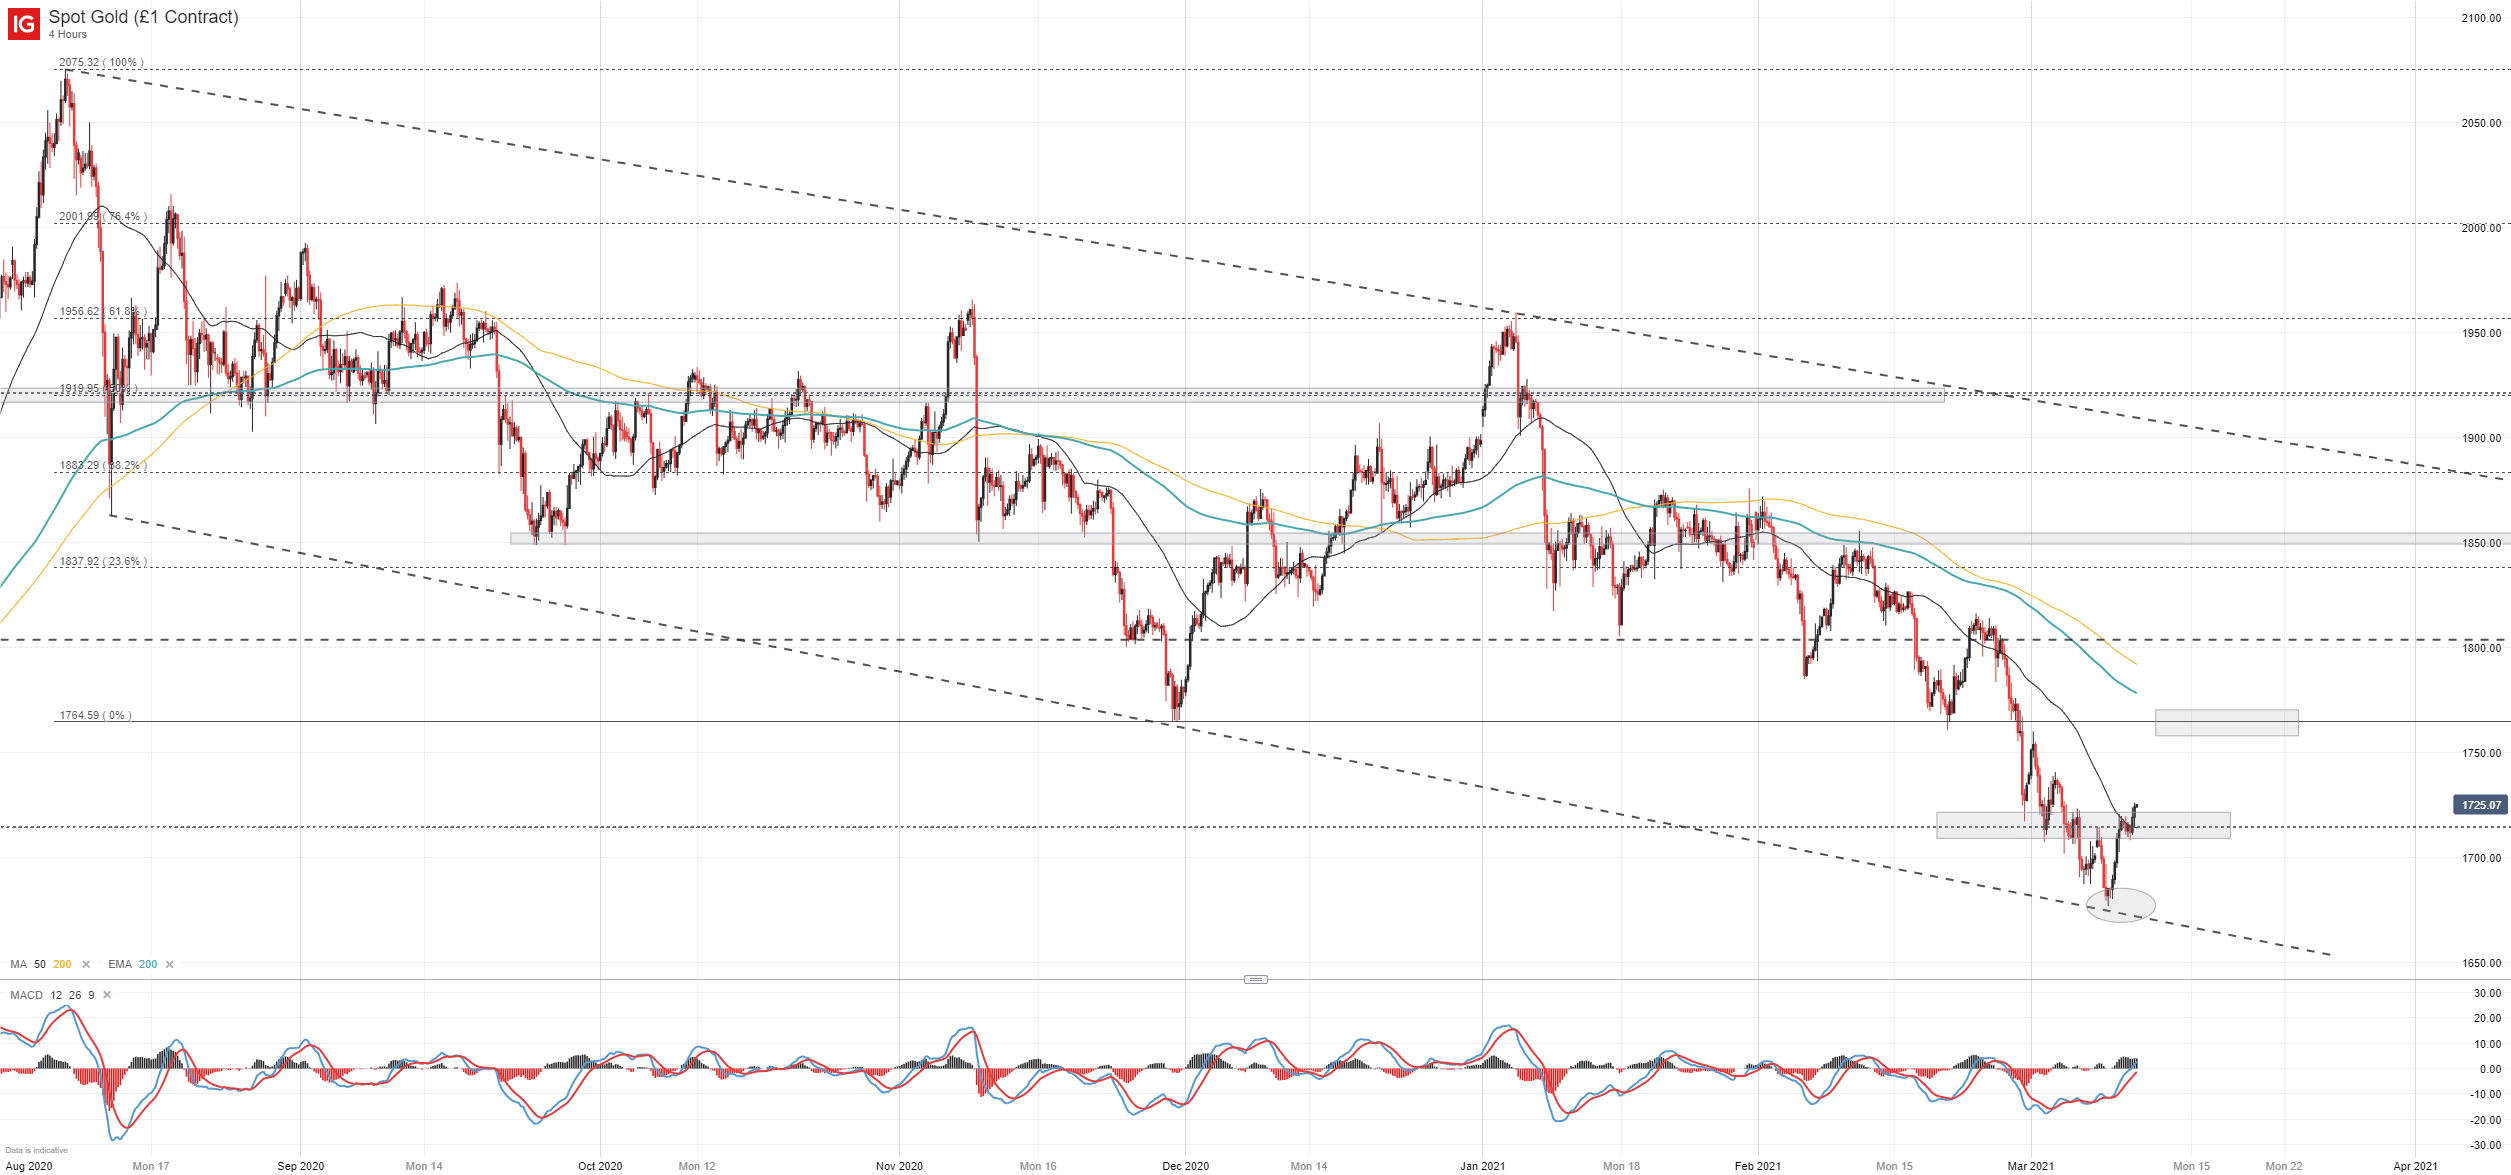
Gold suffered significant declines in the last two weeks as the precious metal fell more than 7% amid rising US Treasury yields. Losses saw XAU/USD blow through various levels of technical support until the lower bound of the metal’s descending channel helped to arrest declines. A picture-perfect bounce off the trendline has seen gold recover somewhat and further consolidation of the extension lower might occur which could see price climb to overhead resistance in the days ahead.
Gold (XAU/USD) Price Chart: 4 – Hour Time Frame (August 2020 - March 2021)
How to Trade Gold: Top Gold Trading Strategies and Tips
Should gold climb higher still, initial resistance might reside along the November low around $1,765 with a potential barrier shortly thereafter around $1,800. Such a retracement would see gold scamper to the midpoint of the descending channel which might then open the door to strategies with bearish biases once more. In the meantime, the risk-reward ratio of bearish exposure appears less than ideal.

That being said, the fundamental landscape remains largely unchanged and if US Treasury yields continue to rise in the weeks ahead, there may be further weakness in store for gold. Aside from the fundamental side of the argument, gold has posted series of lower highs and lower lows consistently since August. With the most recent leg lower taking aim at support around $1,675 and the death cross formation in early January, the longer-term technical outlook remains bearish in my view.

Gold has shown few signs the larger downtrend since August will suddenly end so there is little to suggest a larger reversal higher to the 200 day moving average or the top end of the descending channel is imminent. As gold awaits its next move, follow @PeterHanksFX on Twitter for updates and analysis.
--Written by Peter Hanks, Strategist for DailyFX.com
Contact and follow Peter on Twitter @PeterHanksFX


