


GOLD, CRUDE OIL PRICE OUTLOOK:
- Gold prices extended a three-day decline after pulling back from key resistance at US$ 1,870
- This week’s FOMC meeting, US GDP and core PCE inflation data may serve as fresh catalysts
- WTI formed a “Double Top” pattern that may lead to a deeper pullback

Gold prices fell slightly on Monday, extending a three-day decline after pulling back from key resistance at US$ 1,870 last week. The DXY US Dollar index edged lower alongside a broad “risk-on” rally in Asia-Pacific equities, but this apparently appeared failed to inspire gold traders to take risk for now. Nonetheless, a packed economic calendar towards the latter part of this week may hint at heightened volatility in currency and commodity trading: the FOMC meeting on January 27th, US Q4 GDP on 28th and Core PCE inflation data on 29th.
Impact of FOMC meeting and fiscal stimulus on gold, crude oil prices:
- Wednesday’s FOMC meeting will reveal Federal Reserve’s interest rate decision (expected to be on hold) and more importantly an update from Jerome Powell about the central bank’s view of the economic outlook as well as clues about future tapering. Although fiscal stimulus may help to cushion some of the pandemic’s economic impact, a still-fragile recovery may warrant a dovish Fed in the near future. This may pave way for further Dollar weakness and underpin gold and crude oil prices.
- A challenging pandemic situation and deteriorating labor market conditions recently pointed to further need for fiscal stimulus too. Treasury Secretary nominee Janet Yellen showed her support for President Joe Biden’s US$ 1.9 trillion Covid-relief package, and she is likely to work closely with Jerome Powell on a fiscal and monetary stimulus combination to foster a post-Covid recovery. Reflation hopes may undermine gold prices but buoy crude oil prices in the medium- to long-term. Since early November, WTI has largely outperformed gold with a whopping 46% gain, while the yellow metal gained only 6.3%.
Impact of US Q4 GDP data on gold, crude oil prices:
- US Q4 GDP is forecasted to expand at a pace of 4.0% QoQ, moderating from a robust rebound of 33.4% seen in the third quarter. A lower-than-expected reading may lead the US Dollar to trade lower and buoy gold prices. Crude oil prices however, might be weighed by a downbeat energy demand outlook that tends to offset the positive impact from a weaker USD.
- A higher GDP reading may lead to the opposite.
Impact of core PCE price index on gold, crude oil prices:
- The core personal consumption expenditures (PCE) inflation gauge is a key consideration for the Fed when determining its policy rates. The PCE price index is expected to be 1.3% YoY in December, well below Fed’s long-term target of 2%. A higher actual reading may stir jittery markets’ nerves and lead the US Dollar to trade higher as it may be perceived to inhibit the Fed’s willingness to ease. Gold and crude oil prices may respond negatively if the US Dollar advances.
- On the flip side, a lower-than-expected PCE inflation reading may cool the USD Dollar and buoy commodity prices.
Both gold and crude oil prices have exhibited historic negative correlation with the DXY US Dollar index, with their past 12-month correlation coefficients with the DXY at -0.80 and -0.58 respectively.
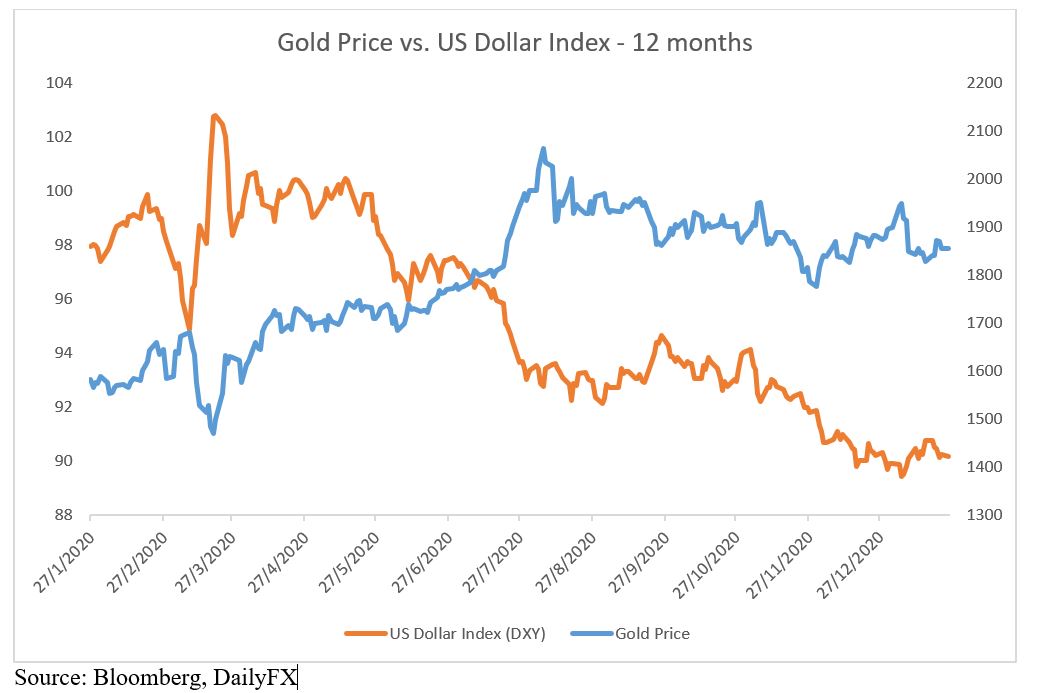
Source: Bloomberg, DailyFX
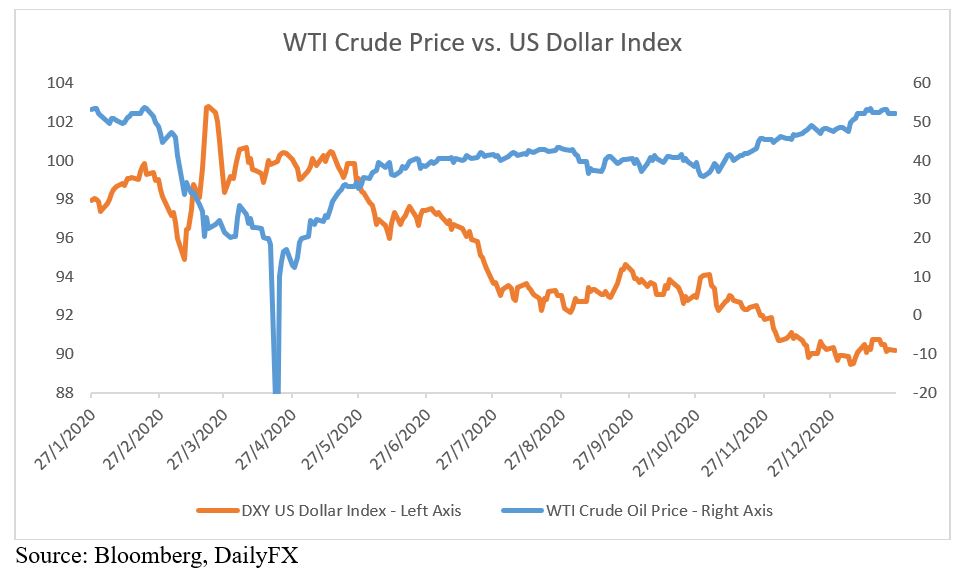
Source: Bloomberg, DailyFX
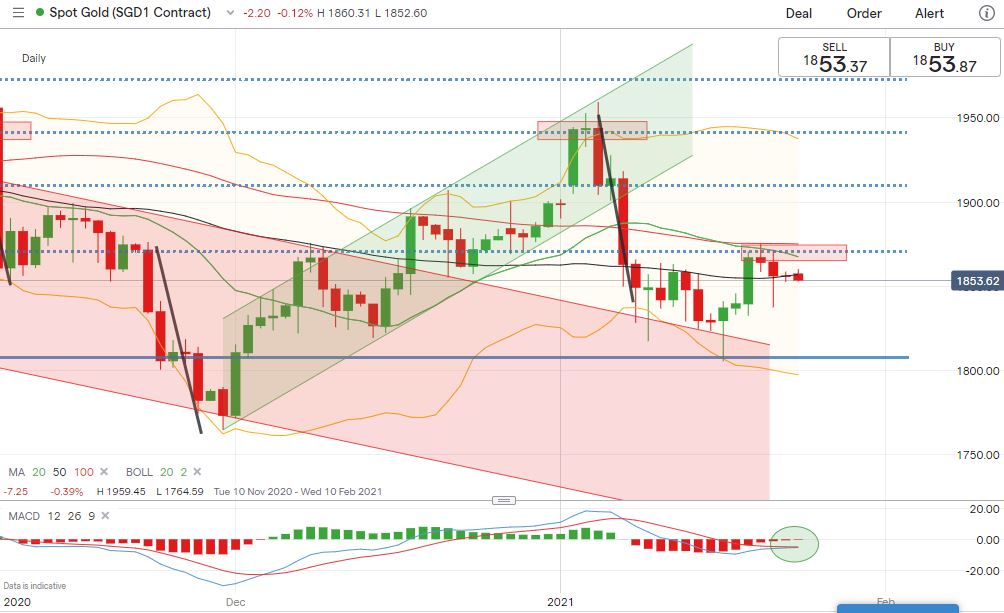
Technically, gold prices have hit an immediate resistance level at US$ 1,870 and have since entered a consolidation. Prices broke below the “Ascending Channel” in early January, indicating strong near-term selling pressure (chart below). The overall trend remains bearish-biased as suggested by the downward-sloped moving average lines. Immediate support and resistance levels can be found at US$ 1,807 (previous low) and US$ 1,870 (76.4% Fibonacci retracement) respectively.
Gold Price – Daily Chart
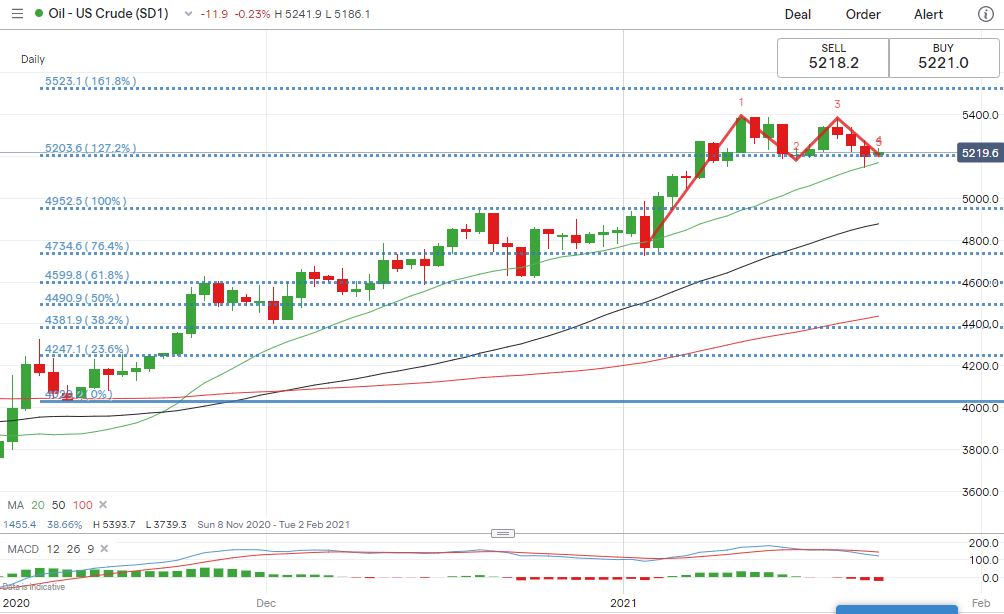
Technically, WTI appears to have formed a “Double Top” pattern as highlighted in the chart below. The pattern may hint at a deeper pullback with an eye on US$ 49.52 (100% Fibonacci extension). The overall trend remains bullish as suggested by the upward-sloped moving average lines. A bearish MACD crossover, however, flags risk of a near-term pullback.
WTI Crude Oil – Daily Chart

--- Written by Margaret Yang, Strategist for DailyFX.com
To contact Margaret, use the Comments section below or @margaretyjy on Twitter


