


Gold Price Outlook:
- After nearly retaking its November highs, gold has suffered a precipitous decline to technical support
- Shorter-term strength in the US Dollar may serve as a headwind while rising yields could prove fatal
- Top 8 Forex Trading Strategies and their Pros and Cons
Gold Price Forecast: Rising Yields Threaten XAU/USD as Technicals Sour
Gold quickly surrendered gains it established at the beginning of the month as the precious metal backed away from its November high around $1965. Recent USD strength was likely a contributing factor to weakness in XAU/USD, but rising yields were likely the more heavy-handed culprit. Considered a safe store of value during market turbulence, gold is inversely correlated with treasury rates as investors can carry risk-free bonds with a certified return instead of the yellow metal which does not provide a return unless it appreciates.
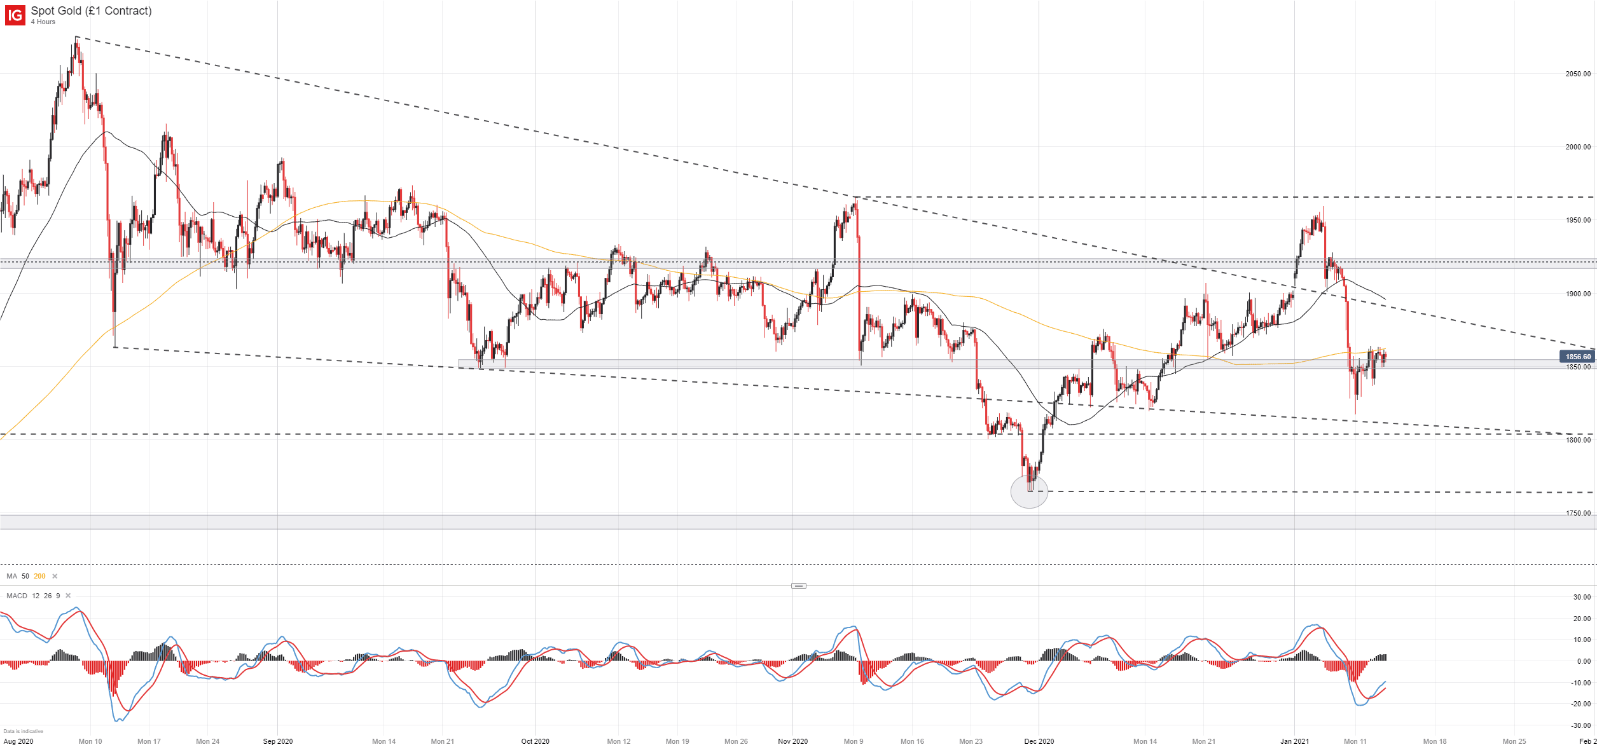
Gold (XAU/USD) Price Chart: 4 – Hour Time Frame (August 2020 - January 2021)
How to Trade Gold: Top Gold Trading Strategies and Tips
The relationship between yields and gold may prove troublesome for the commodity as rates have begun to rise – and rise swiftly. The increase coincided with the recent downturn in XAU/USD as the metal backed off resistance and plunged to support along the descending trendline derived from the August swing-low. Should yields continue to rise, gold may experience further downward pressure and seek out secondary and tertiary support just north of $1800 and off the November low of $1765.

Still, US 10-year yields have already slowed their ascent and there is little to suggest a meteoric rise that might push gold beneath the November low. Furthermore, a continued rise in treasury yields might elicit a response from the Federal Reserve in the form of yield curve control which may cap the return of treasuries and effectively backstop the precious metal.
Combined with potential fiscal stimulus to the tune of trillions of Dollars, there are arguments to be made for a continuation higher in gold over the longer-term. That being said, the current technical landscape is one of weakness.
Gold (XAU/USD) Price Chart: Daily Time Frame (February 2020 - January 2021)
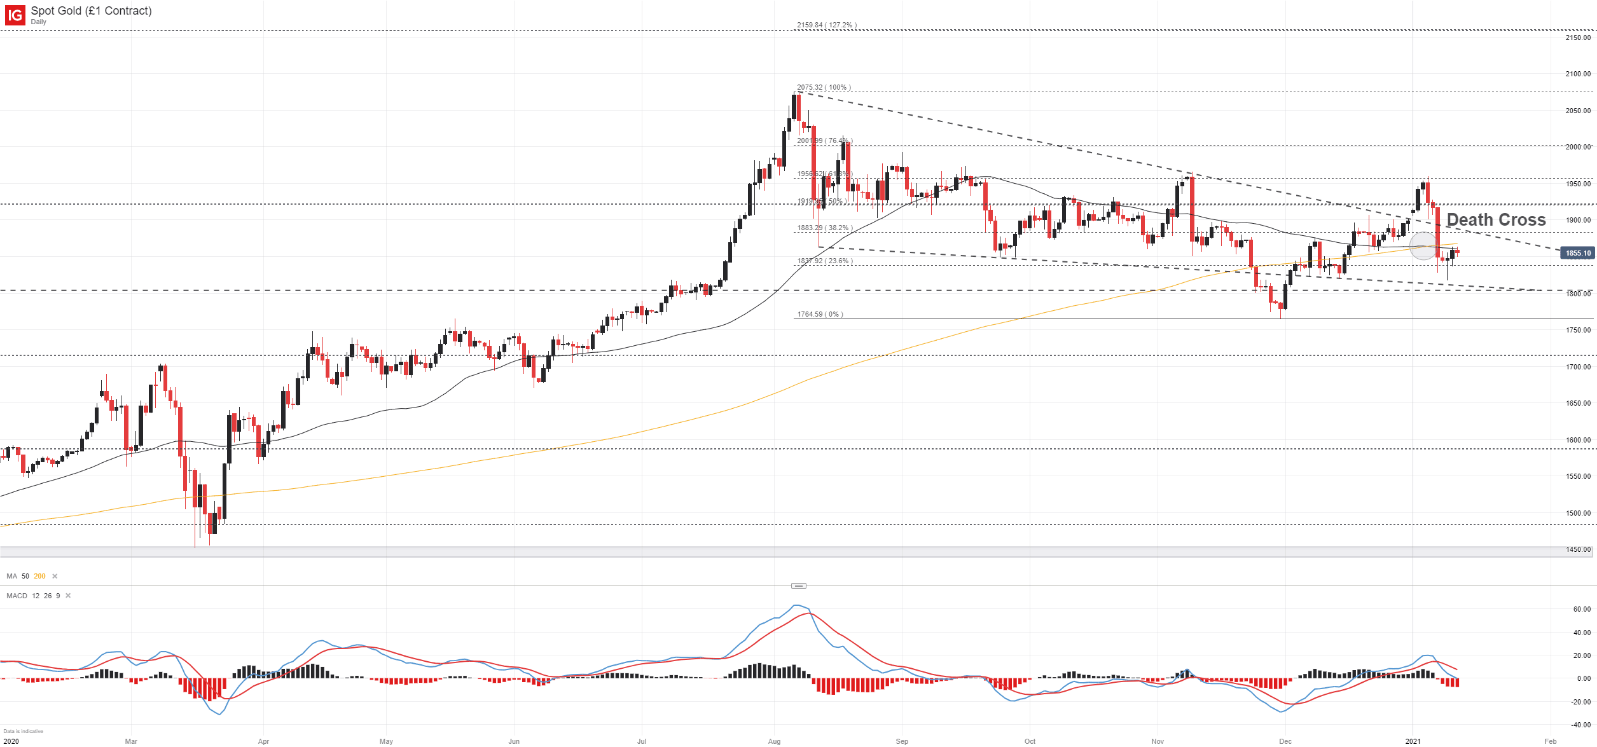
The prolonged decline since August has etched out a series of lower-highs while the November trough is yet another concerning development. Together, price action has painted a picture that might suggest further losses before a meaningful recovery. A freshly-posted “death cross” formation on the daily chart is the most recent indication gold weakness may persist. In the meantime, follow @PeterHanksFX on Twitter for updates and analysis.

--Written by Peter Hanks, Strategist for DailyFX.com
Contact and follow Peter on Twitter @PeterHanksFX


