


USD/CAD Price, News and Analysis:
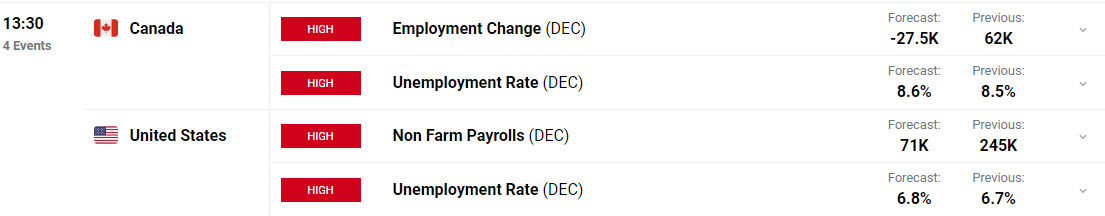
The monthly look at employment figures in both the United States and Canada today will direct USD/CAD in the short-term but the longer-term trend looks likely to remain in place for now. Both countries are expected to see a slight rise in their respective unemployment rates, but as with all economic data, the devil is in the detail, making today’s release a focal point for USDCAD traders.
For all market-moving economic data and events, see the DailyFX Calendar.
NFP and Forex: What is NFP and How to Trade It?
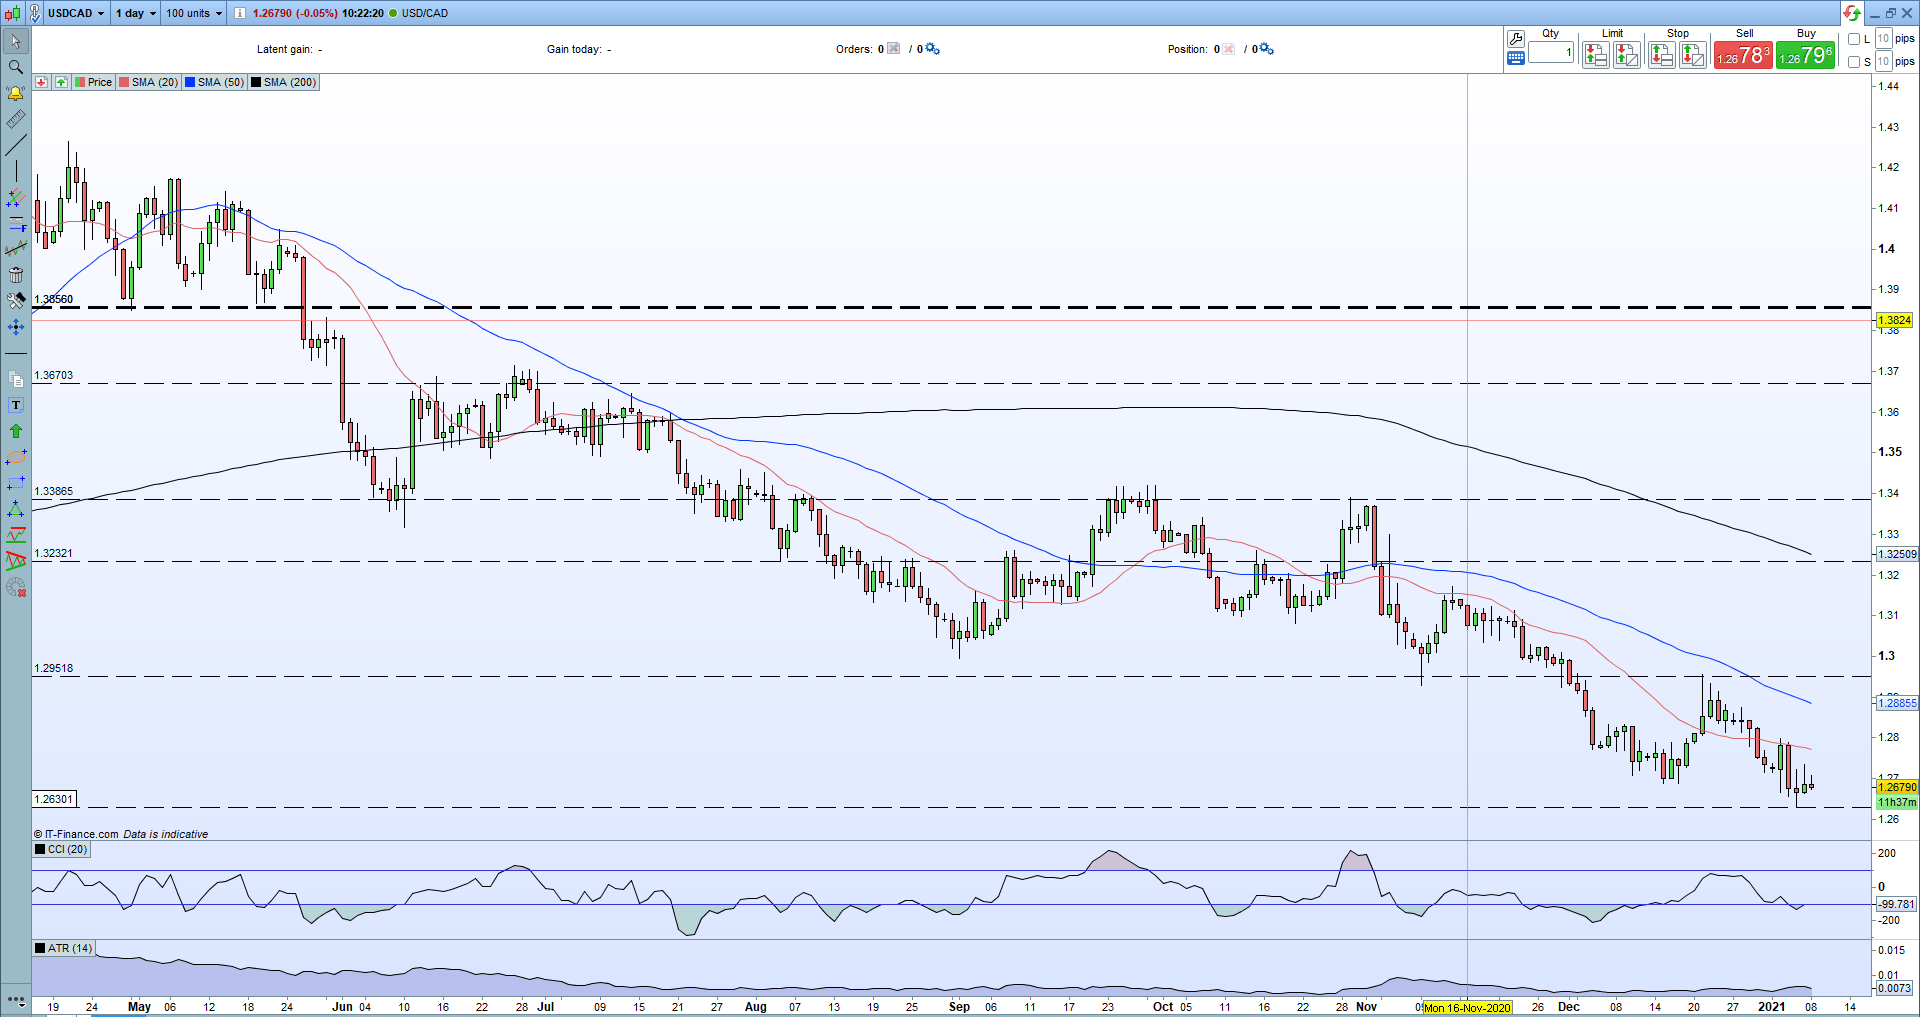
The daily chart shows that the pair has been in a well defined downtrend since mid-March, driven primarily by a weaker US dollar and given a boost of late by a stronger oil complex. Both central banks remain highly accommodative with a well-articulated approach to boosting their economies and pushing inflation back to target. The recent weakness of USD/CAD however will have hurt the Canadian export sector and made the central bank’s 2% inflation target harder to achieve, something that will have been noted by the BoC. A further sell-off in the pair may bring some verbal intervention from the central bank in an effort to stem further losses.

The chart shows the pair treading water today ahead of the data releases. This week’s print at 1.2630 was a 32-month low and remains close to the current spot price at 1.2680. The pair trade below all three moving averages, with the 20- and 50-dmas in particular capping any upside breaks, while the CCI shows the pair in oversold territory. Any upside move is likely to find initial resistance between 1.2770 and 1.2800.
USD/CAD Daily Price Chart (April 2020 – January 8, 2021)
| Change in | Longs | Shorts | OI |
| Daily | -2% | 7% | 5% |
| Weekly | -30% | 38% | 13% |
IG Retail trader data show 66.03% of traders are net-long with the ratio of traders long to short at 1.94 to 1. Positioning is more net-long than yesterday but less net-long from last week. The combination of current sentiment and recent changes gives us a further mixed USD/CAD trading bias.
What is your view on USD/CAD – bullish or bearish?? You can let us know via the form at the end of this piece or you can contact the author via Twitter @nickcawley1.


