


Gold (XAU/USD) Analysis, Price and Chart
- Gold eyes the downside as bond yields tick higher.
- Bearish chart signals starting to appear.
Gold touched $1,900/oz. Wednesday after the Democrats won both Georgia run-off election seats, prompting fresh suggestions that a renewed fiscal stimulus package would weaken the US dollar further. In addition, US Treasury bond yields rose throughout the day on fears that inflation may start to appear down the line, driven by renewed fiscal largesse. The closely-watched US 10-year yield rose back above one percent, a nine-month high, while US 10-year real yields remained around -1.0% despite the uptick in notional yields. Furthermore, the US 2-year/10-year yield curve steepened to levels last seen nearly three years ago, a further indicator that investors are starting to, very gradually, price in a recovery in the US. Against this slightly more optimistic economic backdrop, gold will struggle to move meaningfully higher.

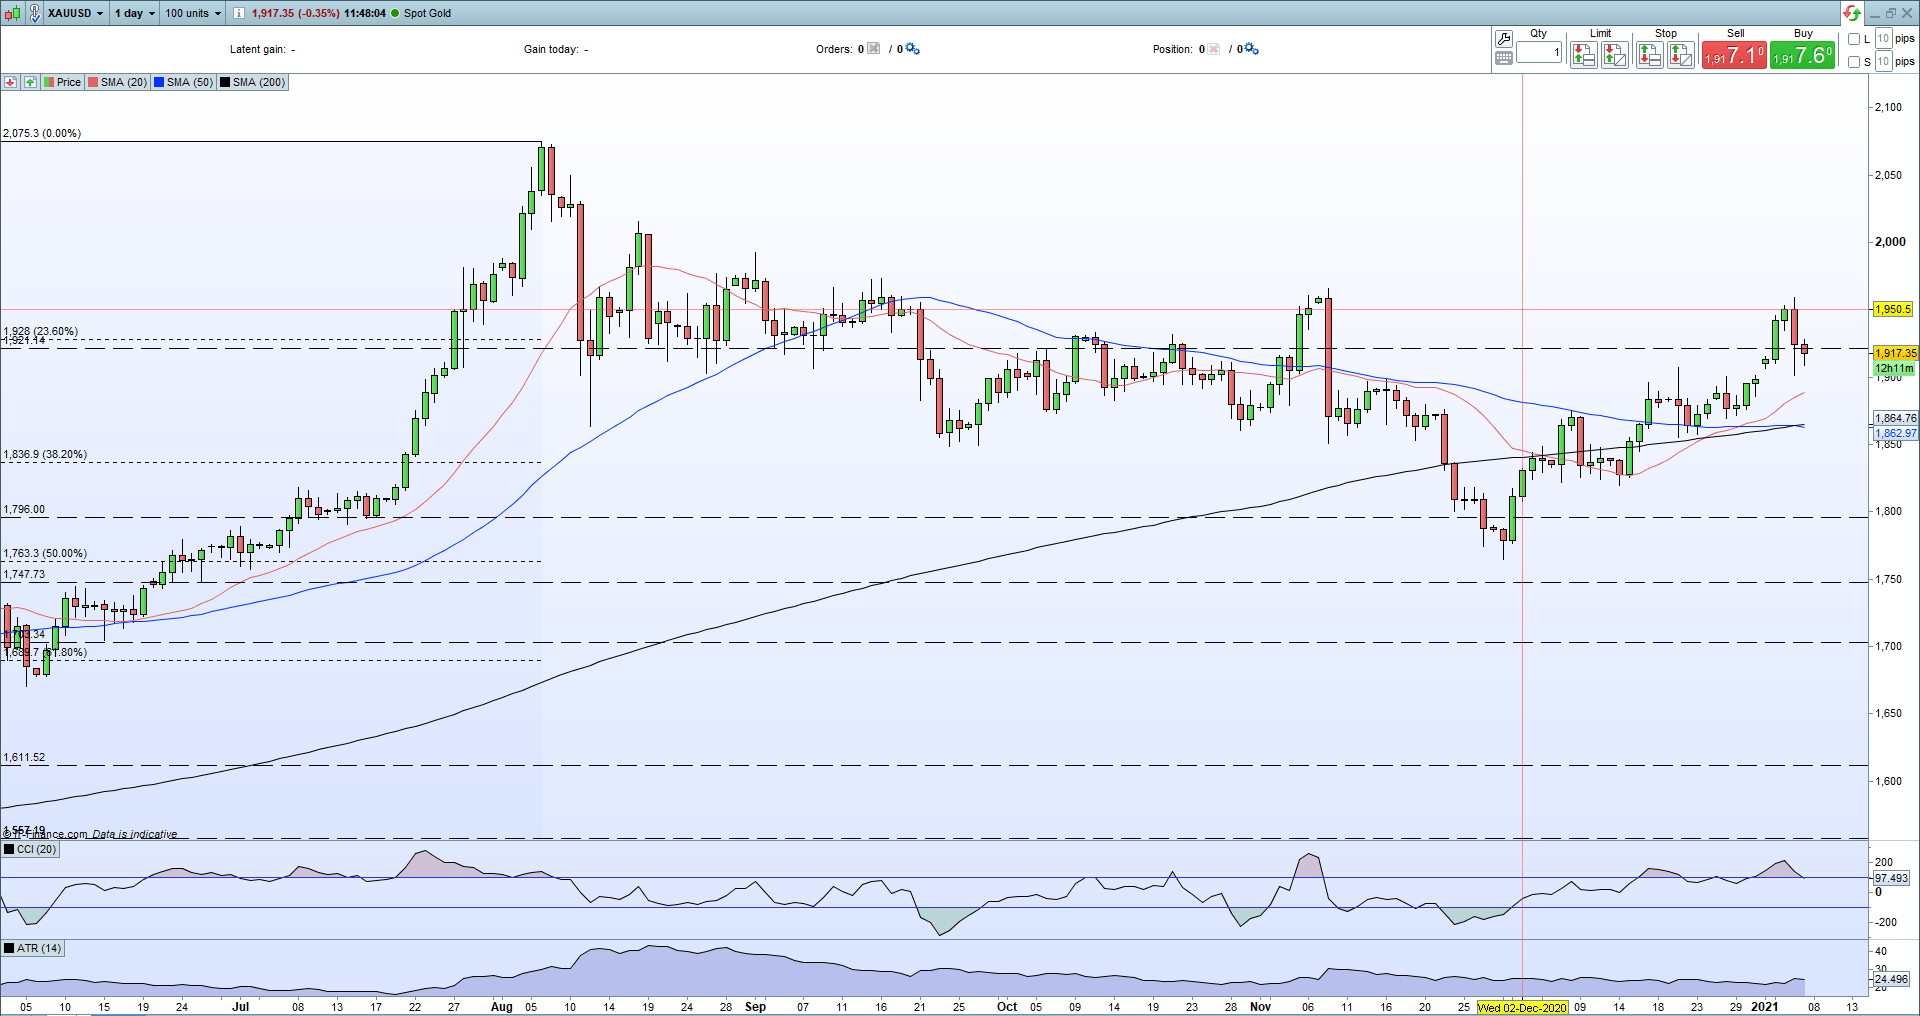
The daily gold chart is now flashing a couple of negative signals that need to be closely watched. A potential ‘death cross’ where the 50-dma trades down through the 200-dma is close to being formed and warrants attention, while yesterday’s bearish engulfing candle also suggests lower prices ahead.
The first level of resistance is around $1,928, from the 23.6% Fibonacci retracement, before $1,960/oz. comes back into play. To the downside, the bottom of yesterday’s sell-off candle is just above $1,900/oz. while the 20-day simple moving average currently sits at $1,888/oz.
Gold Daily Price Chart (June 2020 – January 7, 2021)
| Change in | Longs | Shorts | OI |
| Daily | 2% | -2% | 0% |
| Weekly | 2% | -7% | -2% |
IG retail trader data show 84.57% of traders are net-long with the ratio of traders long to short at 5.48 to 1. We typically take a contrarian view to crowd sentiment, and the fact traders are net-long suggests Gold prices may continue to fall.Traders are further net-long than yesterday and last week, and the combination of current sentiment and recent changes gives us a stronger Gold-bearish contrarian trading bias.
What is Market Sentiment and How Does it Work?
What is your view on Gold – are you bullish or bearish?? You can let us know via the form at the end of this piece or you can contact the author via Twitter @nickcawley1.


