


S&P 500, NIKKEI 225, ASX 200 INDEX OUTLOOK:
- ASX 200, Nikkei 225 indexes face a souring day as US stocks retreated from record highs
- British Prime Minister Boris Johnson introduced national lockdown on England
- Rising gold, copper and iron ore prices underpinned metals and mining stocks, VIX jumped

S&P 500, Lockdown, Gold, Asia-Pacific at Open:
US stocks retreated from their record highs on the first trading day of 2021, setting a souring tone for Asia-Pacific trading open. The Nikkei 225, ASX 200 and Hang Seng Index futures are positioned to trade lower following a bearish US lead, while the VIX volatility index surged to a two-week high.
On the geopolitical front, Iran was reported to have resumed enriching uranium to 20% purity, which signals a breach of the 2015 nuclear deal. Iran has also seized a South Korean ship transiting the Persian Gulf. Rising geopolitical tension might be one of the reasons behind gold’s 2.3% rally seen overnight and it may catalyze further liquidation should the situation escalate. Gold prices have likely broken a key chart resistance and thus opened the door for further upside potential. Read more on my gold report here.
News crossed the wires that a national lockdown will be imposed on the UK and that Germany may extend its lockdown further weighed on sentiment. Still-climbing coronavirus cases around the globe even after an initial rollout of Covid-19 vaccines point to a bumpy road to recovery, and the resulting disruption in business activity in most parts of the US and Europe appears to have spurred a new round of profit-taking.
Australia’s ASX 200 index may exhibit resilience against external headwinds thanks to rising gold, copper and iron ore prices backed by strong demand from Asia. The ASX 200 Index trades mildly lower at the open, underpinned by materials (+1.35%) and information technology (+0.07%) sectors while real estate (-1.59%) and energy (-1.56%) were lagging.
VIX Volatility Index
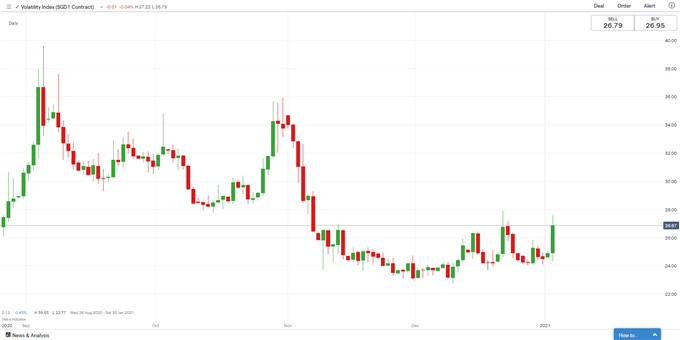
Chart by IG
Sector-wise, 10 out of 11 S&P 500 sectors ended lower, with 84.2% of the index’s constituents closing in the red on Monday. Real estate (-3.29%), utilities (-2.60%) and industrials (-2.55%) were among the worst performers, whereas energy (+0.13%) registered a small gain.
S&P 500 Sector Performance 04-01-2021
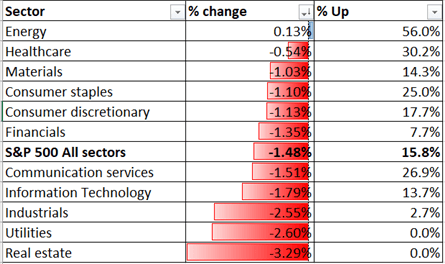
Source: Bloomberg, DailyFX
S&P 500 Top 10 Stock Performance 04-01-2021
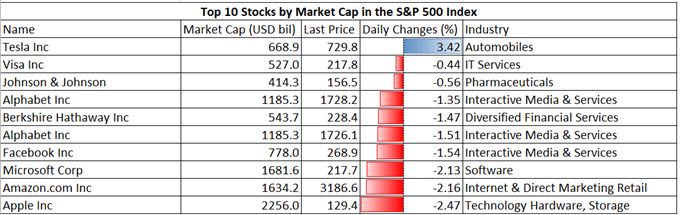
Source: Bloomberg, DailyFX

On the macro front, German retail sales, unemployment rate and US ISM Manufacturing PMI are among the top events today. Find out more from DailyFX calendar.
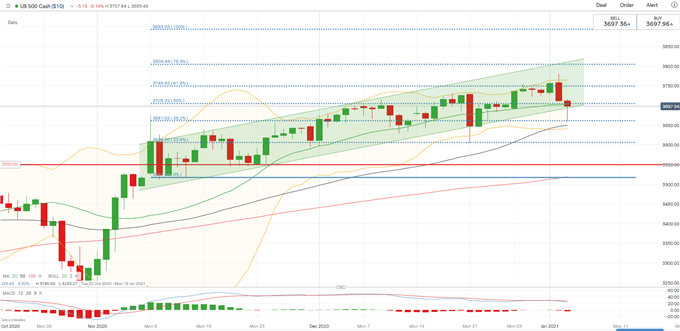
S&P 500 Index Technical Analysis
The S&P 500 indexis testing the lower bound of “Ascending Channel” formed since early November, the breaching of which could signal a deeper technical pullback. The overall trend remains bullish-biased, although a MACD divergence flags risk of depleting upward momentum. Immediate support and resistance levels can be found at 3,660 (38.2% Fibonacci extension) and 3,750 (61.8% Fibonacci extension) respectively.
S&P 500 Index – Daily Chart
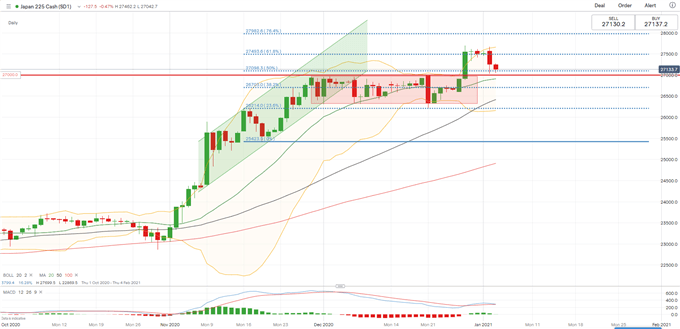
Nikkei 225 Index Technical Analysis:
The Nikkei 225 index has broken a range formed since early December as highlighted in the red color below, and since entered a period of consolidation. Price may come back and retest the upper bound of the rectangle, which is at around 27,000. The overall trend remains bullish-biased as suggested by upward-sloped 20-, 50- and 100-Day Simple Moving Average (SMA) lines, albeit a technical pullback appears to be underway.
Nikkei 225 Index – Daily Chart
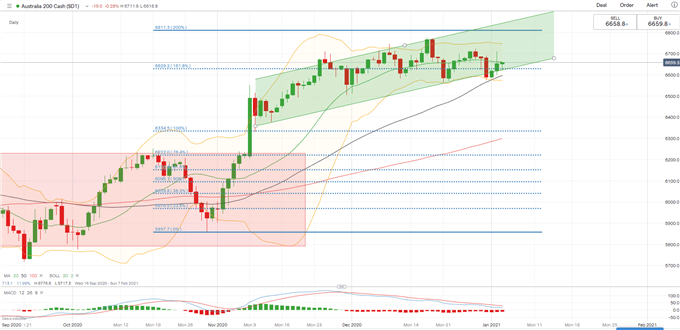
ASX 200 Index Technical Analysis:
The ASX 200 index remains within its “Ascending Channel” as highlighted on the chart below, but upward momentum appears to be faltering as the MACD indicator trends lower. An immediate support level can be found at 6,630 – the 161.8% Fibonacci extension level. A firm break down below this level may open the door for further losses. An immediate resistance level can be found at 6,748 – the upper Bollinger band.
ASX 200 Index – Daily Chart

--- Written by Margaret Yang, Strategist for DailyFX.com
To contact Margaret, use the Comments section below or @margaretyjy on Twitter


