


CRUDE OIL PRICE OUTLOOK:
- WTI crude oil prices erased earlier losses and climbed to US$ 47.00 as USD retreated
- Vaccine rollout and an impending US relief package appear to be supporting prices
- OPEC+ warned about a slower pace of recovery in oil demand next year, inventory report in focus
Crude oil prices erased earlier losses and are back to their 9-month highs on Tuesday, underpinned by a softer US Dollar as well as hopes for a bipartisan US fiscal stimulus plan to be revealed later today. US lawmakers have decided to split the US$ 908 billion stimulus package into two separate proposals, making it easier to strike at least a partial deal that is needed to support small businesses, jobless benefits and vaccine distribution.
Meanwhile, New York and London risk stricter lockdown measures leading into the Christmas season in the wake of the rapid resurgence of coronavirus infections. Equity indices across the US and Asia-Pacific markets traded lower on Tuesday as sentiment soured.
The prospects for a gradual rollout of vaccines around the globe, among other positive catalysts, have fueled a 40% rally in WTI prices since early November. For now, more time might be needed for the vaccines to bring down the number of coronavirus cases before travel restrictions can be removed in major economies such as the UK, Canada and the US. That said, the energy demand outlook remains fragile in the near term.
Daily New Covid-19 Cases - Worldwide
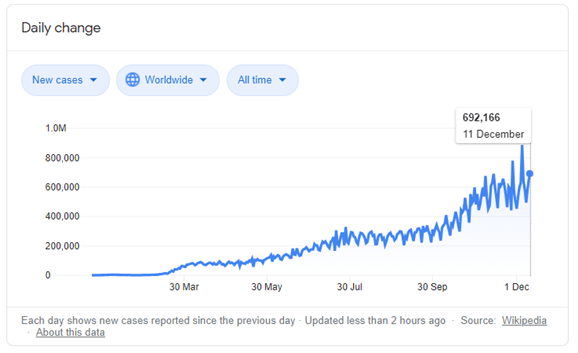
Source: Google
Earlier this week, OPEC+ said that global energy demand will rebound more slowly in 2021 than previously anticipated due to the lingering impact of the Covid-19 pandemic. The oil cartel and its allies have agreed to gradually phase out production cuts early next year as part of their effort to support oil prices.
Oil traders may watch this Wednesday’s FOMC meeting for clues about the Federal Reserve’s forward monetary policy guidance, which will likely have an impact on the US Dollar. Although the consensus points to no change in the Federal Reserve policy rate and its accommodative stance, any twist in the bond-purchasing program and comments about job market weakness could lead to heightened volatility. The DXY US Dollar index and WTI have registered a negative correlation coefficient of -0.29 over the past 12 months (chart below).
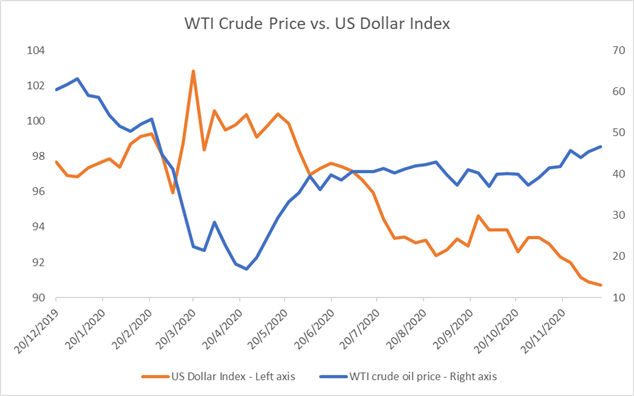
Source: Bloomberg, DailyFX
Traders are anticipating a 3-million-barrel decline in US crude inventories for the week ending December 11th, with the actual data coming in on December 16th. Last week, markets saw a whopping 15.2-million-barrel increase in stockpiles, but oil traders appeared not to have been discouraged by this seemingly one-off spike. Still, this may hint that markets are probably too complacent about vaccine and stimulus hopes, rendering oil prices vulnerable to a pullback should we see continuous build in crude stockpiles in the weeks to come. Oil prices have historically displayed a negative correlation with inventories, with a past-12 month correlation coefficient of -0.408.
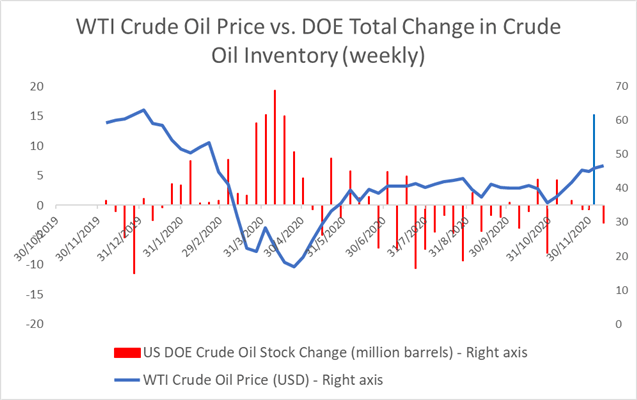
Source: Bloomberg, DailyFX

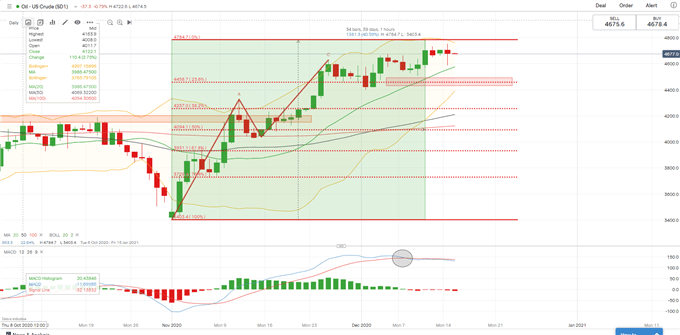
Technically, upward momentum appears to be faltering for WTI, with its MACD indicator forming a “Death Cross” and trending lower. For now, price is well-supported by the 20-Day Simple Moving Average (SMA) line, although the width of its Bollinger Band is narrowing.
An immediate resistance level can be found at US$ 47.80 – a recent high. A failed attempt to breach this level may result in a pullback to test its 20-Day SMA line. Breaking below the 20-Day SMA may open the door for further losses, with an eye on US$ 44.58 – the 23.6% Fibonacci retracement.
WTI Crude Oil Price – Daily Chart

--- Written by Margaret Yang, Strategist for DailyFX.com
To contact Margaret, use the Comments section below or @margaretyjy on Twitter


