


Bitcoin (BTC/USD) Outlook:
- Bitcoin bulls eager to break resistance
- Price action remains within the limits of the Bollinger Bands
- Could the Evening Star formation be a glimmer of hope for bears?
Can Bitcoin Bulls Hold On?
Bitcoin continues to maintain the upward trajectory that has prevailed since March 2020, buoyed by US Dollar weakness and global economic conditions. Although the recent rally has seen an increase in the demand for Bitcoin and other major cryptocurrencies, the sustainability of the bullish trend is being questioned after prices reached an all-time high on December 1, 2020, resulting in BTC/USD surging over 160% in the year-to-date.

While fundamentals may play a role in determining the next big move, with US stimulus talks and concerns surrounding loose monetary policy weighing on investor sentiment, trading psychology will likely be an additional driver of price action, with many fearing the reoccurrence of 2017’s events, when the ‘Bitcoin bubble’ eventually burst.
Bitcoin Price Action Seeks Direction
After reaching an all-time high of $19,861, the momentum of the uptrend subsided, pushing price action into a confluent zone, between the Fibonacci retracement levels (between September 2020 and December 2020) which continue to hold as support and resistance. On the daily time-frame, price action remains within the parameters of the Bollinger Bands, while the Relative Strength Index (RSI) hovers around 60.

Bitcoin (BTC/USD) Daily Chart
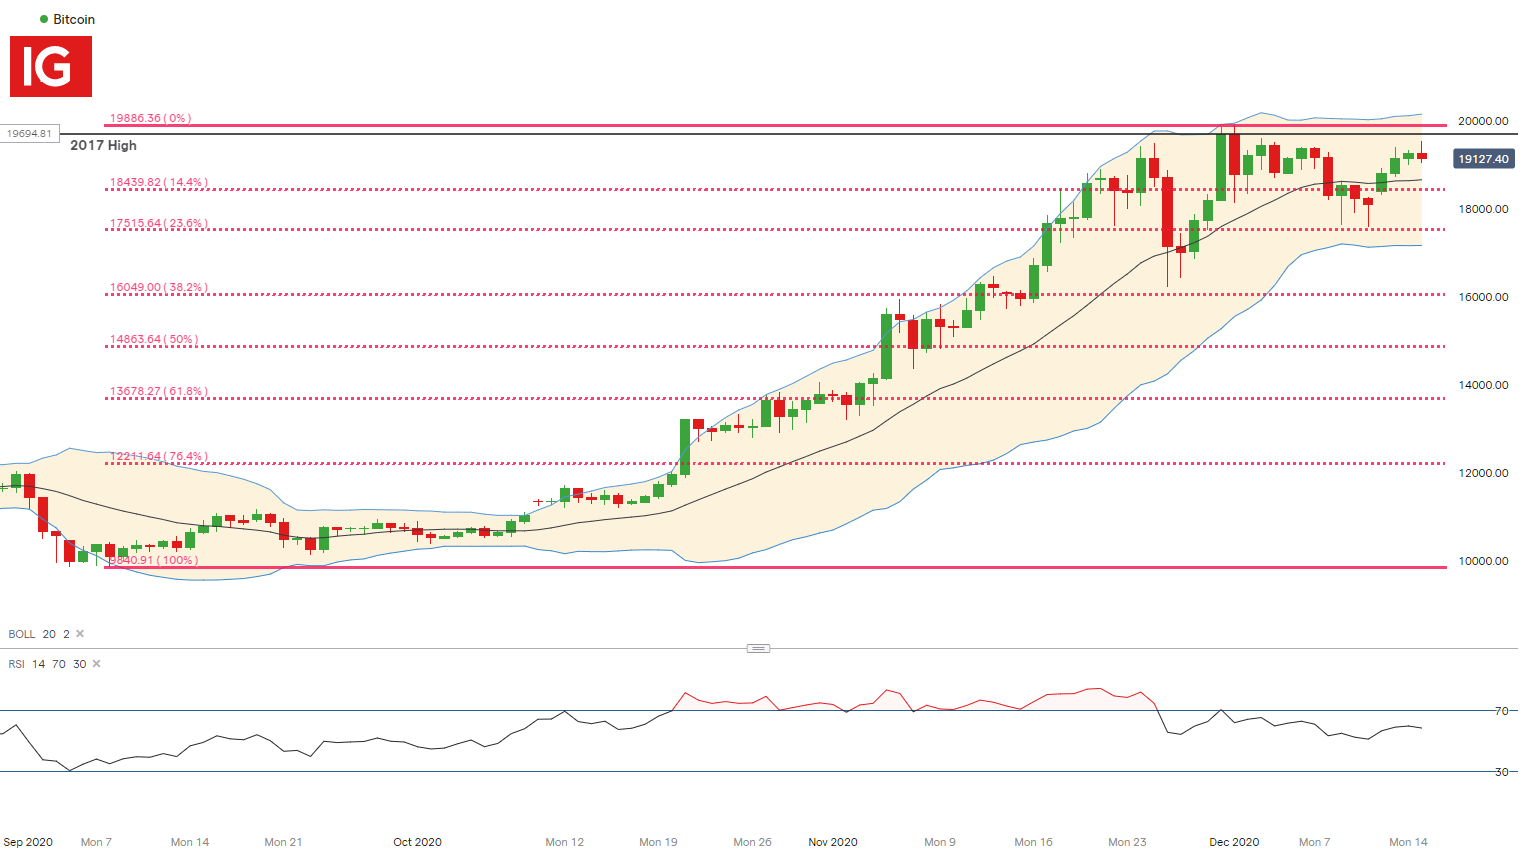
Chart prepared by Tammy Da Costa, IG
Evening Star Formation may Hold Bulls at Bay
Meanwhile, the formation of an Evening Star on the two-hour chart suggests that a bearish reversal is probable, but as long as the uptrend remains intact a bullish continuation cannot be ruled out.
Bitcoin (BTC/USD) 2-Hour Chart

Chart prepared by Tammy Da Costa, IG
For now, the 20-period Moving Average (the central line used in Bollinger Bands) continues to provide support at $18,636. A break below this level could see the 23.6% retracement level coming into play as support at $17,515.64. However, if bulls are able to maintain control, the December high may once again be tested, as well as resistance at the key psychological level of $20,000.
--- Written by Tammy Da Costa, Market Writer for DailyFX.com
Contact and follow Tammy on Twitter: @Tams707


