


Natural Gas, Warmer U.S. Temperature Forecast, Technical Outlook – Talking Points
- Natural gas prices see little relief in the near-term
- Inventory levels remain elevated on annual basis
- Prices in danger of piercing under 100-day SMA
Natural gas prices sank 9.43% last week as warmer temperature forecasting evaporated sentiment. Since November, natural gas prices are down almost 25%. The recent losses may extend if the next forecast doesn't give a bullish outlook for the heating gas. So far, temperatures have been above average across most of the United States since November.
NOAA 8-14 Day Outlook Temperature Probability

Source: NOAA
Given the bearish weather forecast, traders will need to look elsewhere for a fundamental driver on prices. One near-term catalyst may be inventory levels from the U.S. Energy Information Administration’s Weekly Natural Gas Storage Report.
However, with the warm weather as of late, a surprise inventory draw seems unlikely. Last week's report showed levels 43 Bcf higher compared to the same period in the prior year, according to the latest EIA report. This seemingly leaves both the supply and demand side for the energy commodity in a bearish stance.
EIA Natural Gas underground storage
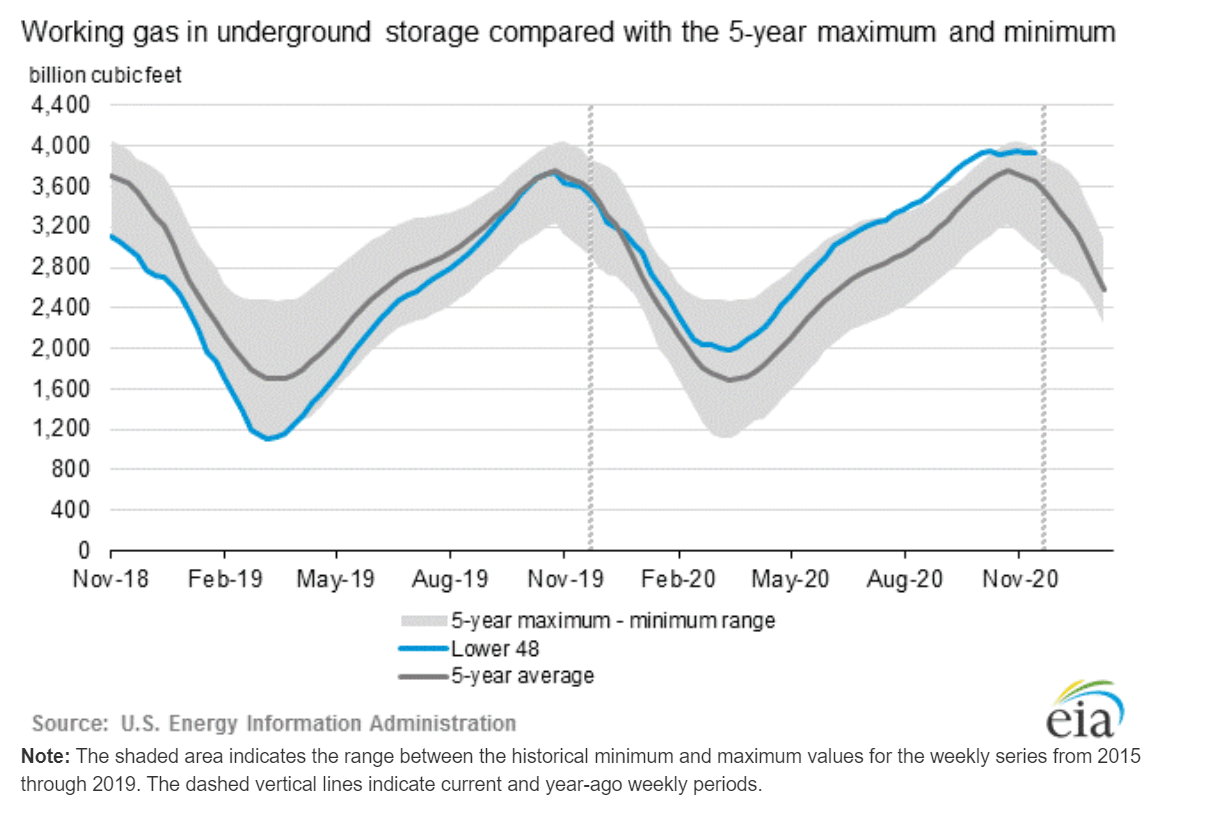
Source: eia.gov
The technical setup may not provide much help for bulls. Last week, prices broke below the 20-day simple moving average (SMA) on Wednesday followed by a violent selloff Thursday, sinking 9.82%. Friday saw an intraday break below the 100-day SMA but prices managed to rally back and close out the session with a 2.71% gain.
The 100-day SMA may struggle to contain further downside, however, and momentum appears to be strengthening in that direction. In fact, the MACD line is accelerating away from its signal line, indicated by the falling MACD histogram. That makes natural gas futures appear primed for a second week of losses.

Natural Gas Daily Chart
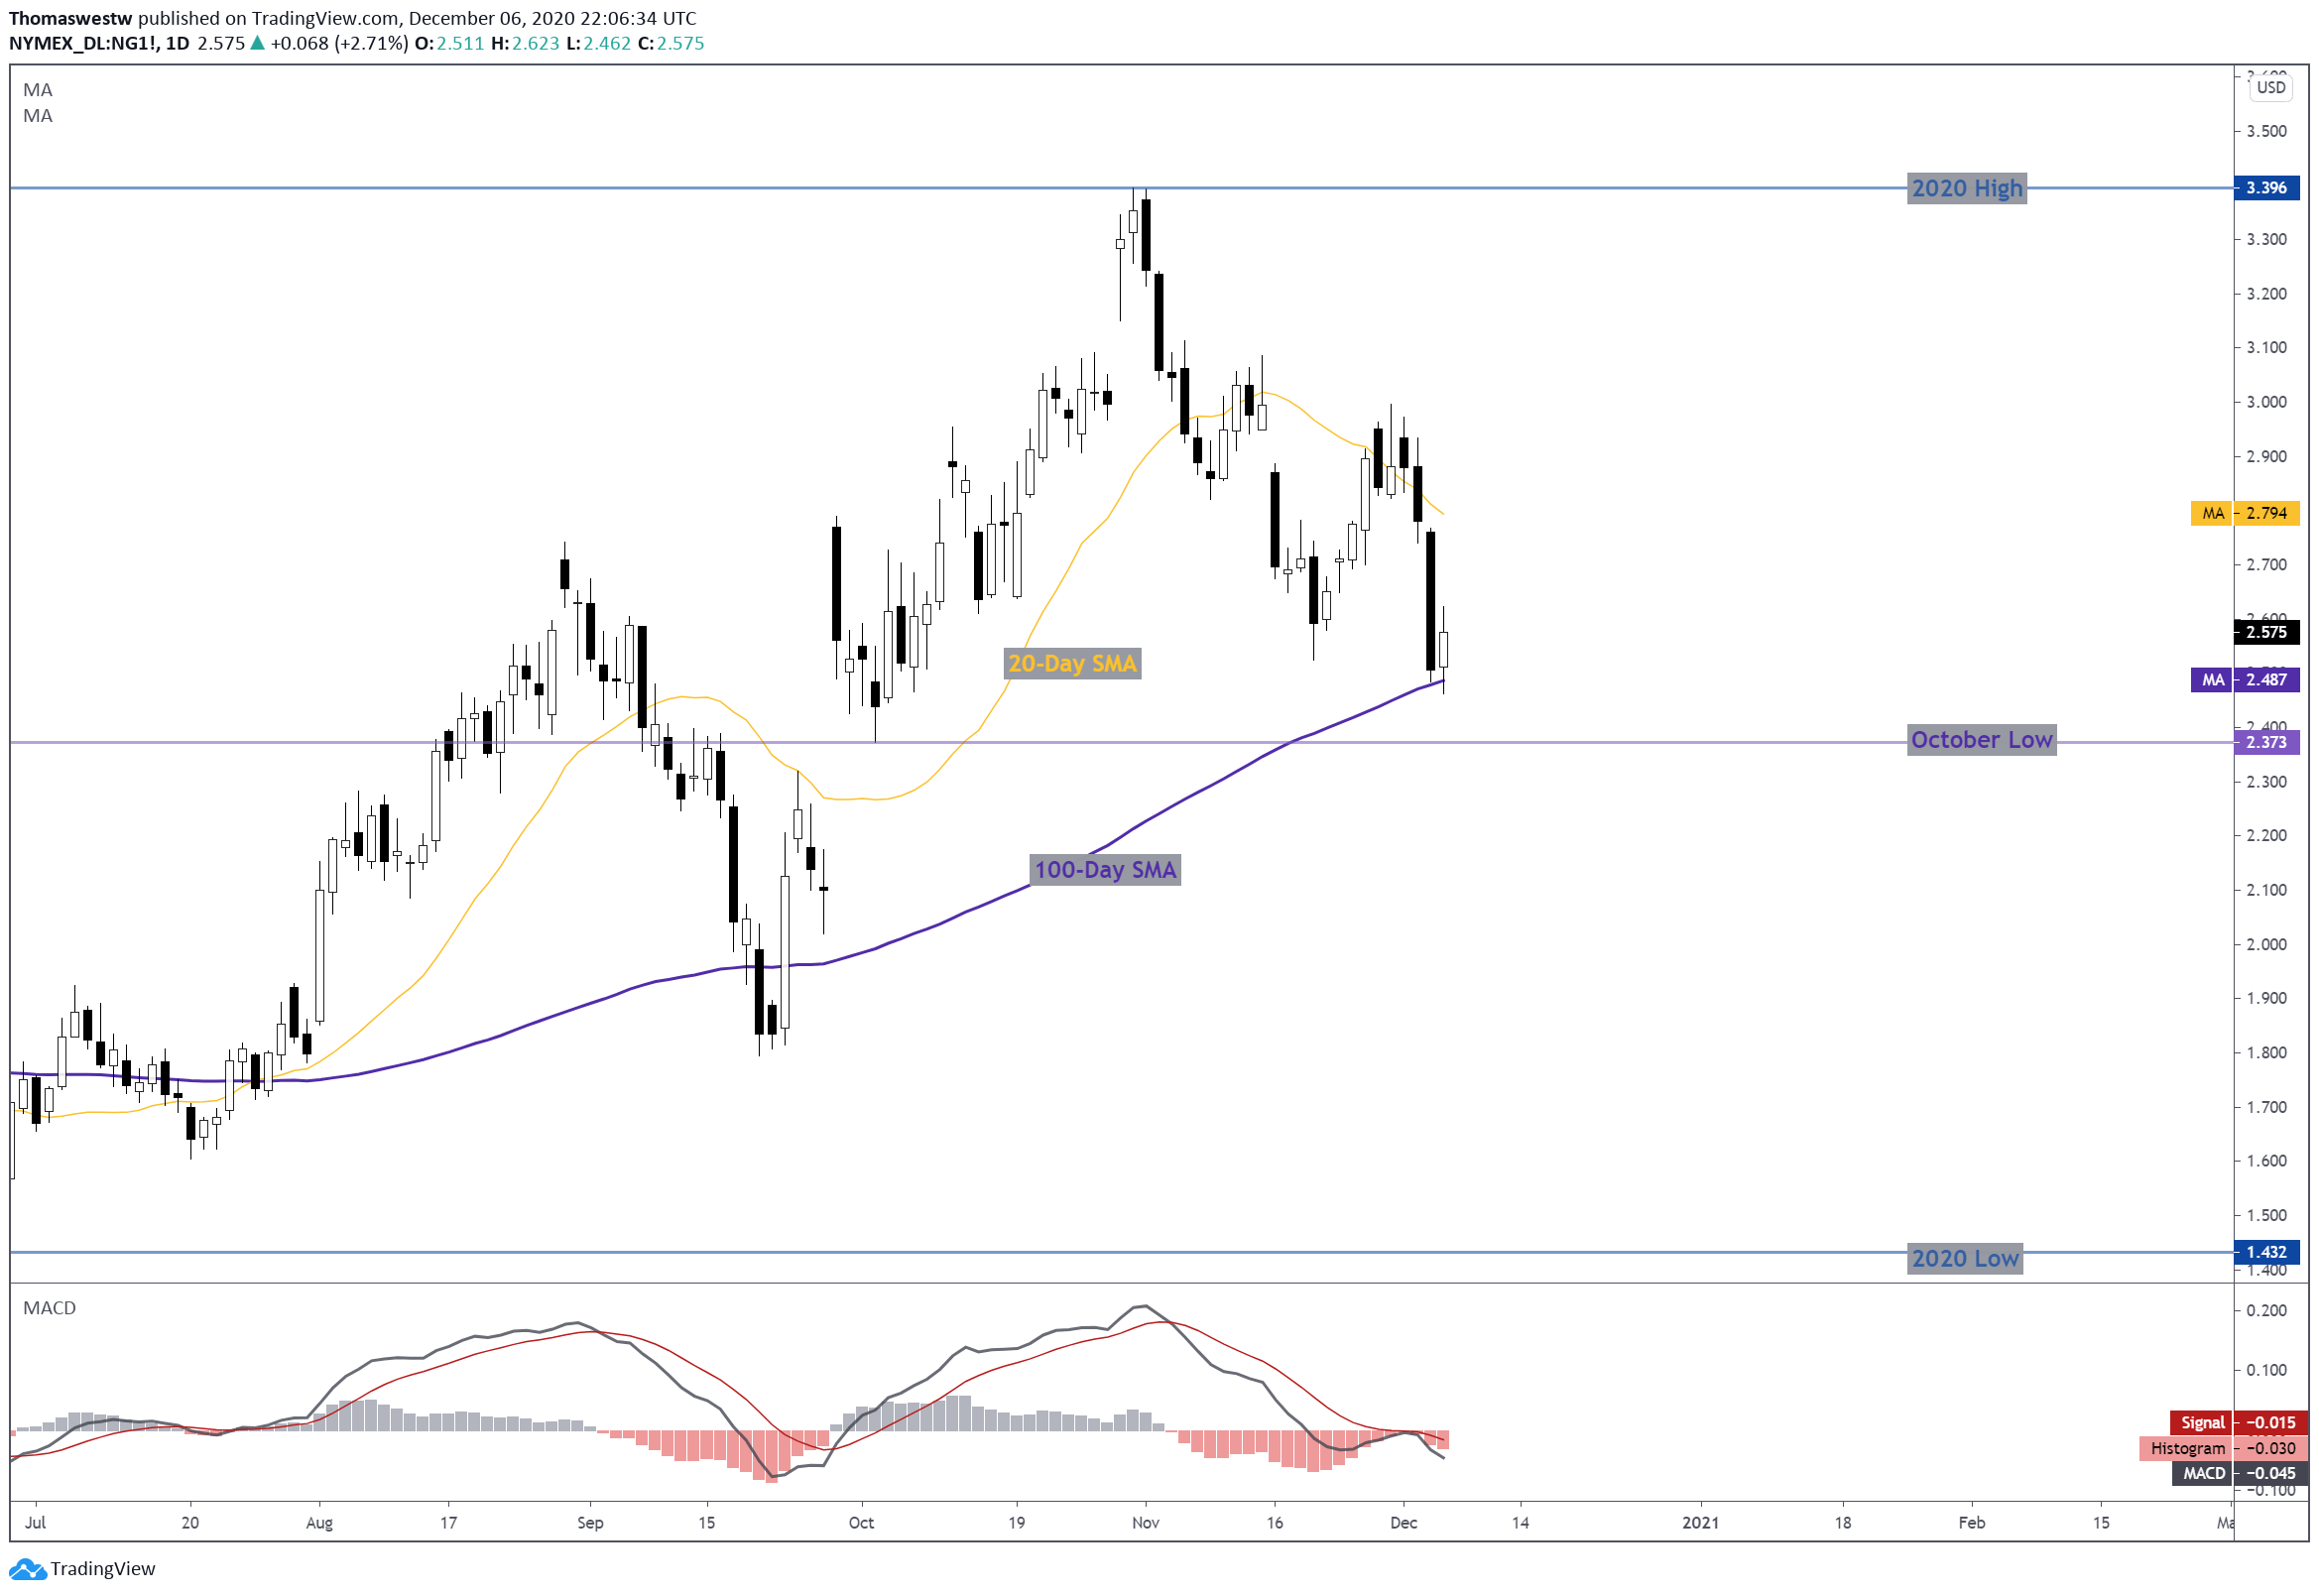
Chart created with TradingView
Natural Gas TRADING RESOURCES
- Just getting started? See our beginners’ guide for FX traders
- What is your trading personality? Take our quiz to find out
- Join a free webinar and have your trading questions answered
--- Written by Thomas Westwater, Analyst for DailyFX.com
To contact Thomas, use the comments section below or @FxWestwater on Twitter


