


Copper prices, XCU/USD, China, Coronavirus Vaccine, Moderna – Talking Points:
- China’s economic recovery appears to be underpinning copper prices.
- Positive vaccine news may also fuel the global-growth proxy’s push to multi-year highs.
- Copper’s push above long-term resistance suggests further gains are in the offing.
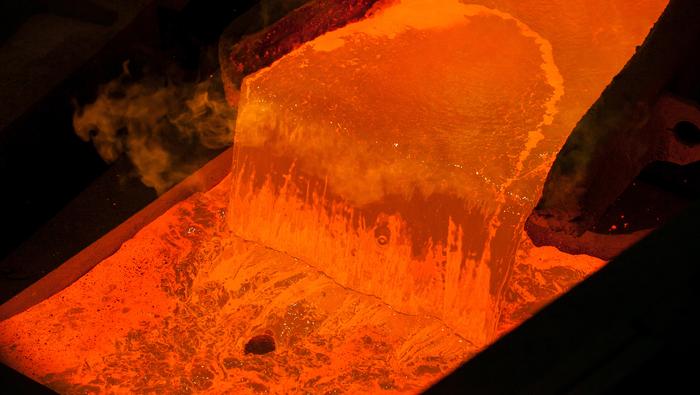
Copper surged to its highest levels since June 2018 yesterday, on the back of positive vaccine news and robust economic data out of China.
Robust Chinese Recovery Underpinning Copper Prices
Chinese industrial production increased by 6.9% year-on-year last month, surpassing consensus estimates and climbing the most since December 2019 while Caixin manufacturing, services and composite PMI prints for October exceeded market expectations.
Retail sales, a key gauge of consumer spending, also rose by 4.3% year-on-year in October, the biggest increase in 10 months.
Tellingly, exports from China spiked 11.4% higher, reflecting a pickup in global demand and perhaps more intense reliance on Chinese manufacturing due to the notable tightening of coronavirus restrictions throughout Europe.
China Industrial Production
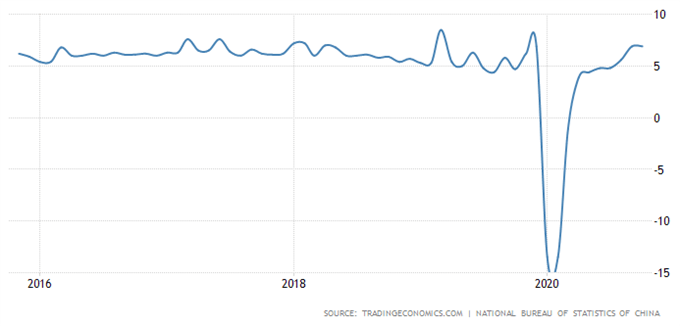
Clearly, the absence of coronavirus cases is allowing the world’s second largest economy to rapidly rebound from the February doldrums and is in turn buoying the global growth proxy.
In fact, National Bureau of Statistics spokesman Fu Linghui stated that “economic growth in the fourth quarter is expected to be even faster than that of the third quarter”, due to China’s “successful containment of Covid-19 and increased availability of funding for local governments”.
Therefore, copper prices may continue to track higher if the trajectory of the Asian powerhouse’s economic recovery remains on the current path.
Moderna Vaccine Efficacy Fuelling Growth Bets
Positive coronavirus vaccine results have reinvigorated global growth bets in recent days and may underpin the ductile metal in the near term.
Clinical trial results showed that the vaccine developed by Moderna – which uses the same mRNA technology as Pfizer’s vaccine - proved to be 94.5% effective in protecting people from the novel coronavirus.
Unlike the vaccine developed by Pfizer however, Moderna’s shot can be stored at a below-freezing temperature equal to those seen in most home and medical freezers.
Cumulative Cases of Covid-19 Globally
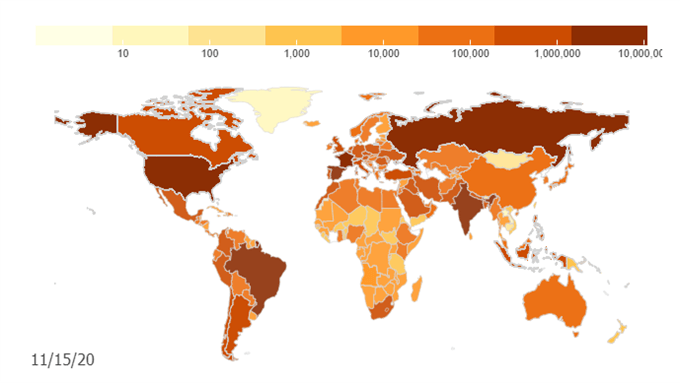
Source – John Hopkins University
This is likely to allow easier distribution and in turn increases the likelihood that economies will return to a level of normalcy by the middle of next year.
Indeed, with Moderna planning to ask federal health authorities to pass the vaccine by early December, there is a distinct possibility that the shot could go into distribution by the end of the year.
As a result, investors may begin to position their portfolios for a return to global growth in 2021, which would likely bolster copper prices.
Copper Futures Weekly Chart (HG) – Break of Long-Term Resistance Hints at Upside

Copper futures weekly chart created using TradingView
The technical outlook for copper remains skewed to the upside, after prices pushed through the 2011 downtrend and resistance at the 38.2% Fibonacci (3.1040).
The MACD indicator’s surge to its highest levels since 2017, combined with a moving average ‘golden cross’ formation, suggests that the path of least resistance is higher.
A challenge of key resistance at the 2017 high (3.3220) looks on the cards if buyers can hurdle psychological resistance at 3.25.
Alternatively, failure to hold above the October high (3.2180) could generate a pullback towards support at the 38.2% Fibonacci (3.1040).
Copper Futures Daily Chart (HG) – Rising Wedge in Play

Copper futures daily chart created using TradingView
Zooming into a daily chart hints at a near-term reversal, as the RSI swerves away from overbought territory and price fails to breach the psychologically imposing 3.25 mark.
Slipping back below the October 21 high (3.2180) would likely open the door for a challenge of Rising Wedge support.
Neutralizing short-term buying pressure probably requires a daily close below the 38.2% Fibonacci (3.1040), a move that would validate the downside break of the bearish reversal pattern.
However, should the support range at 3.1980 – 3.2200 stay intact, further gains appear in the offing.
A daily close above the November 16 high (3.2625) is needed to signal the resumption of the primary uptrend and bring the 2017 high (3.3220) into focus.
-- Written by Daniel Moss, Analyst for DailyFX
Follow me on Twitter @DanielGMoss


