Dow Jones Price Forecast:
- Dow Jones price action formed an evening star candlestick on Wednesday
- The pattern typically suggests a reversal is imminent, which could see the DJIA fall further
- Forex Candlesticks: A Complete Guide for Forex Traders
Dow Jones Forecast: Evening Star Candlestick Hints at Reversal Potential
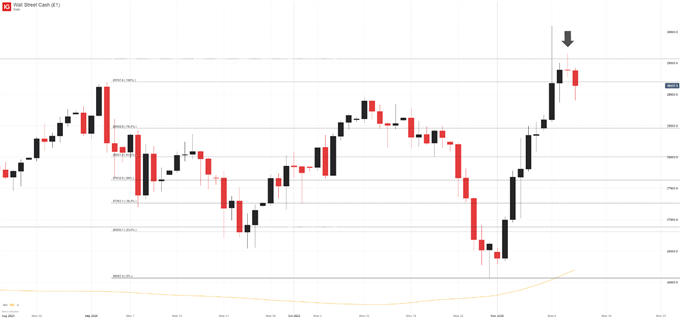
After surging to record highs to start the week, price action in the Dow Jones has slowed somewhat and sellers have had the upper hand in the week’s second half. As a result, the Industrial Average formed an evening star formation on the daily chart, followed quickly by a pullback in Thursday trade. Typically viewed as a sign that a reversal might occur, the appearance of the evening star could suggest the Dow Jones is vulnerable to further losses.
Dow Jones Price Chart: Daily Time Frame (August 2020 – November 2020)

That being said, the longer-term trend for the Dow Jones, Nasdaq 100 and S&P 500 likely remains higher, so losses may serve has healthy consolidation. While it is difficult to say how far the indices, particularly the Dow Jones, will consolidate, nearby technical levels might lend some insight.
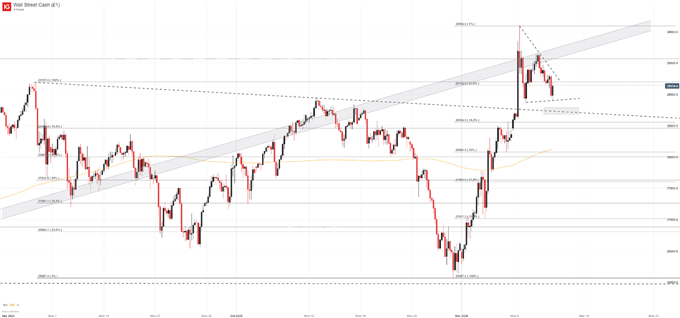
Dow Jones Price Chart: 4 - Hour Time Frame (September 2020 – November 2020)

To that end, initial support may reside along the trendline drawn off the September and October highs. Residing near the 28,725 mark, the trendline could provide some buoyancy if the Dow looks to consolidate further. Beyond the line, secondary support might stand around 28,468. Looking lower still, 28,000 may serve as another possible zone where the Dow could receive support.
If, however, the follow-through on the evening star is lacking and the Dow Jones continues higher in the immediate future, initial resistance might reside along the underside of the ascending band from June. This technical level has offered influence at various points for months, so it may be fair to suspect it will again in the future. In the meantime, follower @PeterHanksFX on Twitter for updates and analysis.
--Written by Peter Hanks, Strategist for DailyFX.com
Contact and follow Peter on Twitter @PeterHanksFX


