


NASDAQ 100, ASX 200 INDEX OUTLOOK:
- Nasdaq 100 index futures extend losses after plunging 1.6% as stimulus hopes fade
- Australia’s ASX 200 index tested a key resistance level at 6,000 where its 50- and 100-Day SMA meet
- The US Dollar index jumped to 93.86, pointing to resurging demand for safety
Nasdaq 100 Index Outlook:
US equity index futures declines at Asia open after registering a big fall on Tuesday. President Trump abruptly called a halt to further fiscal stimulus talks. The Democratic-proposed $2.2 trillion package, versus the $1.6 trillion Republican one, is aimed to support a fragile economy that is recovering from the pandemic. If Democratic presidential candidate Joe Biden wins the November election, it is likely that he and his Democratic colleagues will only be able to push through the package until after his inauguration in late January, over 3 months from now.
Besides, president Trump’s health condition is being closely scrutinized by market participants after his returning to the White House shortly after testing positive for Covid-19. Joe Biden urged Trump not to debate if he is still positive for Covid for the second round, paving way for more election uncertainty in the weeks to come.

Sector-wise, ten out of eleven S&P 500 sectors closed lower on Tuesday, with over 80% of the constituent companies in the red. A clear ‘risk off’ pattern was observed in the US session, with consumer discretionary (-2.13%), communication services (-1.98%) and information technology (-1.59%) were among the hardest hit due to fading stimulus talk hopes. Defensive-linked utilities (+0.86%) and consumer staples (-0.67%) were slightly outperformed.
Nasdaq Sector Performance 6-10-2020
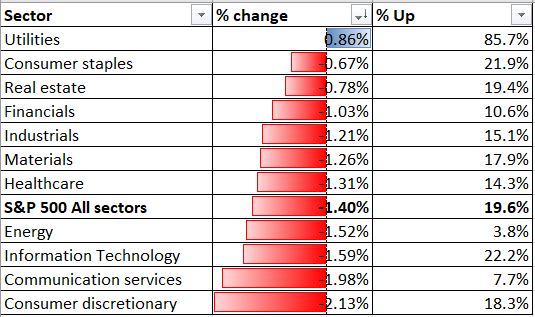
Source: Bloomberg, DailyFX
Asia-Pacific markets may follow US leads lower, as the futures market suggests. The economic calendar is relatively quiet today, with Fed meeting minutes in focus. Read more on our economic calendar.

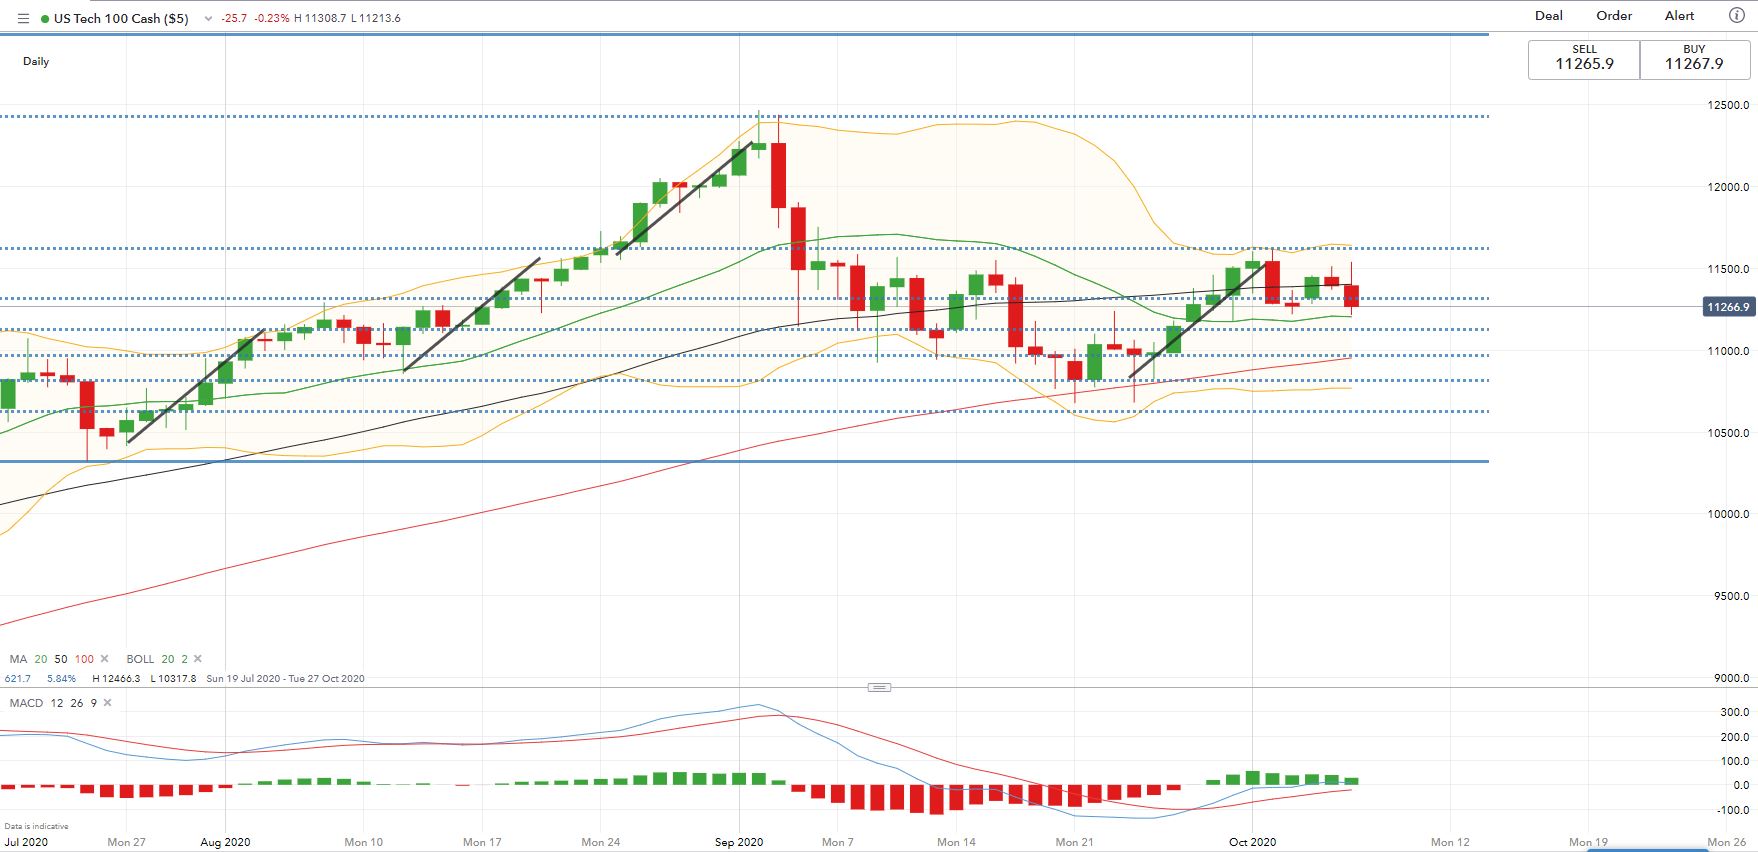
Technically,the Nasdaq 100 index has penetrated into the upper Bollinger Band and may find an immediate support level at 11,200 (20-Day Simple Moving Average {SMA}). The Bollinger Band width has narrowed recently, suggesting that the index may continue to consolidate between 11,200 and 11,600 for the time being.
The MACD indicator remains in the positive territory, but upward momentum appears to have slowed down. A breakdown below 11,200 (20-Day SMA) will likely open room for further downside towards 11,123 (61.8% Fibonacci extension) and then 10,970 (50% Fibonacci extension).
Nasdaq 100 Index – Daily Chart
ASX 200 Index Outlook:
The ASX 200 index could dismiss external headwinds and push higher on the back of the Australian government's Federal Budget announcement, in which Treasurer Josh Frydenberg announced a record deficit and a staggering amount of fiscal support in an attempt to drag the nation out of its first recession in 29 years.
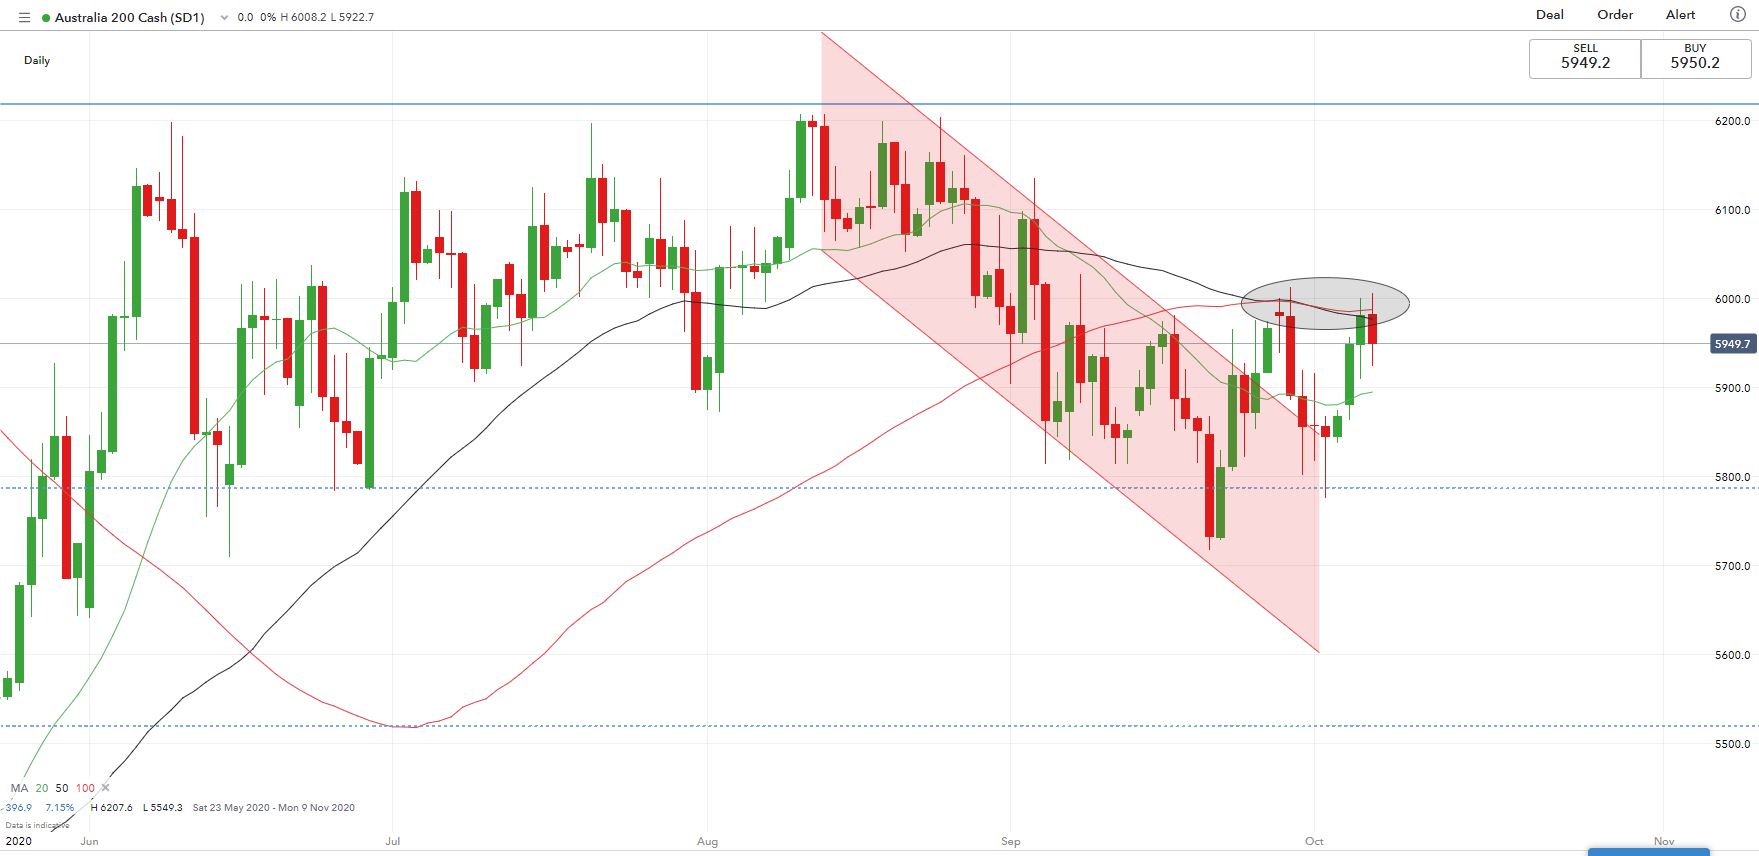
The index is challenging a key resistance level at 6,000, where the 50- and 100-Day SMA lines overlaps (chart below). A failure to break above 6,000 may lead to further consolidation towards immediate support levels at 5,900 (20-Day SMA) and then 5,800 (23.6% Fibonacci retracement).
ASX 200 Index – Daily Chart
--- Written by Margaret Yang, Strategist for DailyFX.com
To contact Margaret, use the Comments section below or @margaretyjy on Twitter


