


S&P 500 PRICE OUTLOOK: STOCKS SLIDE SHARPLY AFTER TRUMP PUTS AN END TO FISCAL STIMULUS NEGOTIATIONS UNTIL AFTER ELECTION
- US President Trump just stopped coronavirus stimulus negotiations until after the election
- S&P 500 price action plunged about 1.5% from intraday highs as stocks nosedive in response
- The Nasdaq and Dow Jones are falling fast as well while the VIX and US Dollar both rip higher
Stocks are notching a nasty intraday reversal to the downside in response to unexpected headlines from US President Trump. POTUS just came out rejecting the $2.2-trillion coronavirus aid package proposed by Democratic House Speaker Nancy Pelosi, which is costlier than the $1.6-trillion stimulus deal set forth by Treasury Secretary Steven Mnuchin on behalf of the Trump administration. Fiscal aid to state and local governments stands out as the largest sticking point leading to the breakdown in stimulus negotiations.

S&P 500 INDEX PRICE CHART WITH NASDAQ, DOW JONES OVERLAID: 5-MINUTE TIME FRAME (05 OCT TO 06 OCT 2020)

Chart created by @RichDvorakFX with TradingView
The S&P 500 - along with other major stock market indices like the Nasdaq and Dow Jones - have been ripping higher since the last week of September amid rekindled fiscal stimulus optimism. Following the latest collapse in stimulus talks, however, stocks have begun declining sharply.
| Change in | Longs | Shorts | OI |
| Daily | 1% | -1% | 0% |
| Weekly | 15% | -13% | -1% |
Not only have fiscal stimulus negotiations collapsed again, President Trump also stated that his team will not resume coronavirus aid talks until after the election. This further delays the delivery of much-needed fiscal stimulus to the US economy, which Federal Reserve Chair Powell has desperately pleaded to politicians for recently as the pace of the economic recovery slows, and to mention, remains very fragile.
US DOLLAR PRICE CHART WITH VIX INDEX OVERLAID: 5-MINUTE TIME FRAME (06 OCT 2020 INTRADAY)
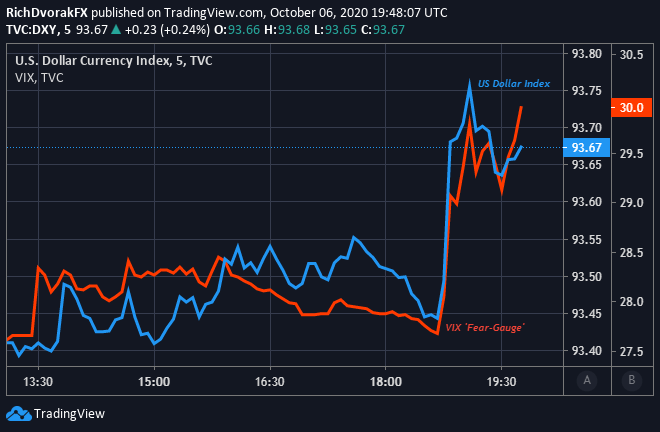
Chart created by @RichDvorakFX with TradingView
Also, the S&P 500 VIX Index, or fear-gauge, has been ripping higher as stocks sell off hard. This influx of risk aversion owing to failed stimulus talks seems to be providing a boost to the US Dollar as well, which is a popular safe-haven currency that tends to rise amid deteriorating market sentiment. Correspondingly, as shown in the chart above, the VIX Index and DXY Index typically move in tandem with one another.

Keep Reading - Dow Jones Forecast: How Will the Election Affect the Stock Market?
-- Written by Rich Dvorak, Analyst for DailyFX.com
Connect with @RichDvorakFX on Twitter for real-time market insight


