


DOW JONES, ASX 200,NIKKEI 225 INDEX OUTLOOK:
- Dow Jones Industrial Average (Dow) futures edged up after rising 1.51% overnight
- ASX 200 index opened higher, challenging an immediate resistance level at the 50-Day SMA
- Nikkei 225 index eyes a key resistance level at 23,500, Japanese Yen little moved
Dow Jones Index Outlook:
Dow Jones Industrial Average index (Dow) futures climbed during early Asia hours after registering a decent two-day gain. Stock market sentiment was revitalized by stimulus hopes after US House Speaker Nancy Pelosi painted a silver lining of the supposedly stalling fiscal package. House Democrats are working on a $2.4 trillion plan, which is $1 trillion lower than the initial proposal but probably higher than what the Trump Administration has signaled it will accept.
The US Dollar Index(DXY) fell a second day to 94.30, alleviating pressure over precious metals and risk assets. Gold and silver both bounced from their recent lows, and the Australian and New Zealand Dollars climbed. The VIX volatility index fell to 31.7, resuming its downward trajectory after some wild moves seen early last week.

Asia-Pacific markets may likely extend gains for a second day, following positive leads from the Wall Street. Traders face a relatively quiet economic calendar, with the first US presidential election debate closely eyed. The live TV debate will be on air from 9:00 pm to 10:30 pm ET September 29th.
Sector-wise, all nine Dow sectors closed in the green, with 90% of the index constituents ending higher. Cyclical-linked materials (+3.13%), energy (+2.92%) and industrials (+2.62%) were among the best performers.
Dow Jones Index Sector performance 28-9-2020

Source: Bloomberg, DailyFX
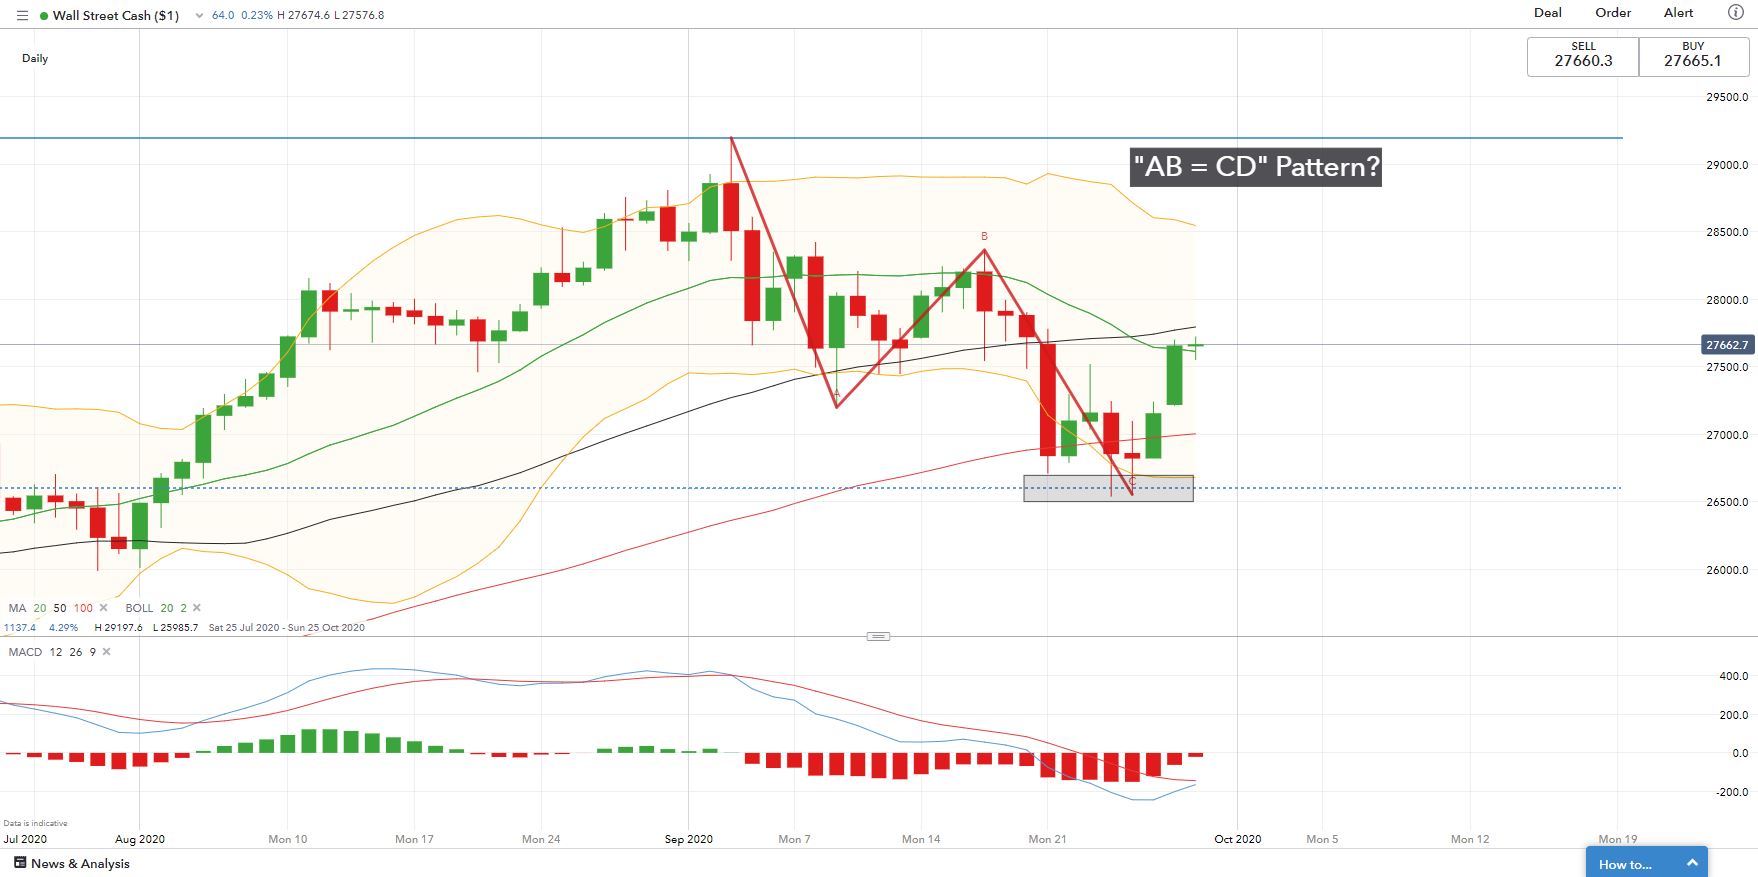
Technically,the Dow has likely formed a bullish “AB=CD” pattern and has since rebounded from the “D” point (chart below). It is now challenging an immediate resistance level at 27,600 – the 20-Day Simple Moving Average (SMA) line. Breaking 27,600 may signal a potential trend reversal as it penetrates into the upper Bollinger Band. This may open room for more upside. The MACD indicator is about to form a “bullish crossover”, suggesting that it is gaining upward momentum.
Dow Jones Index – Daily Chart
ASX 200 Index Outlook:
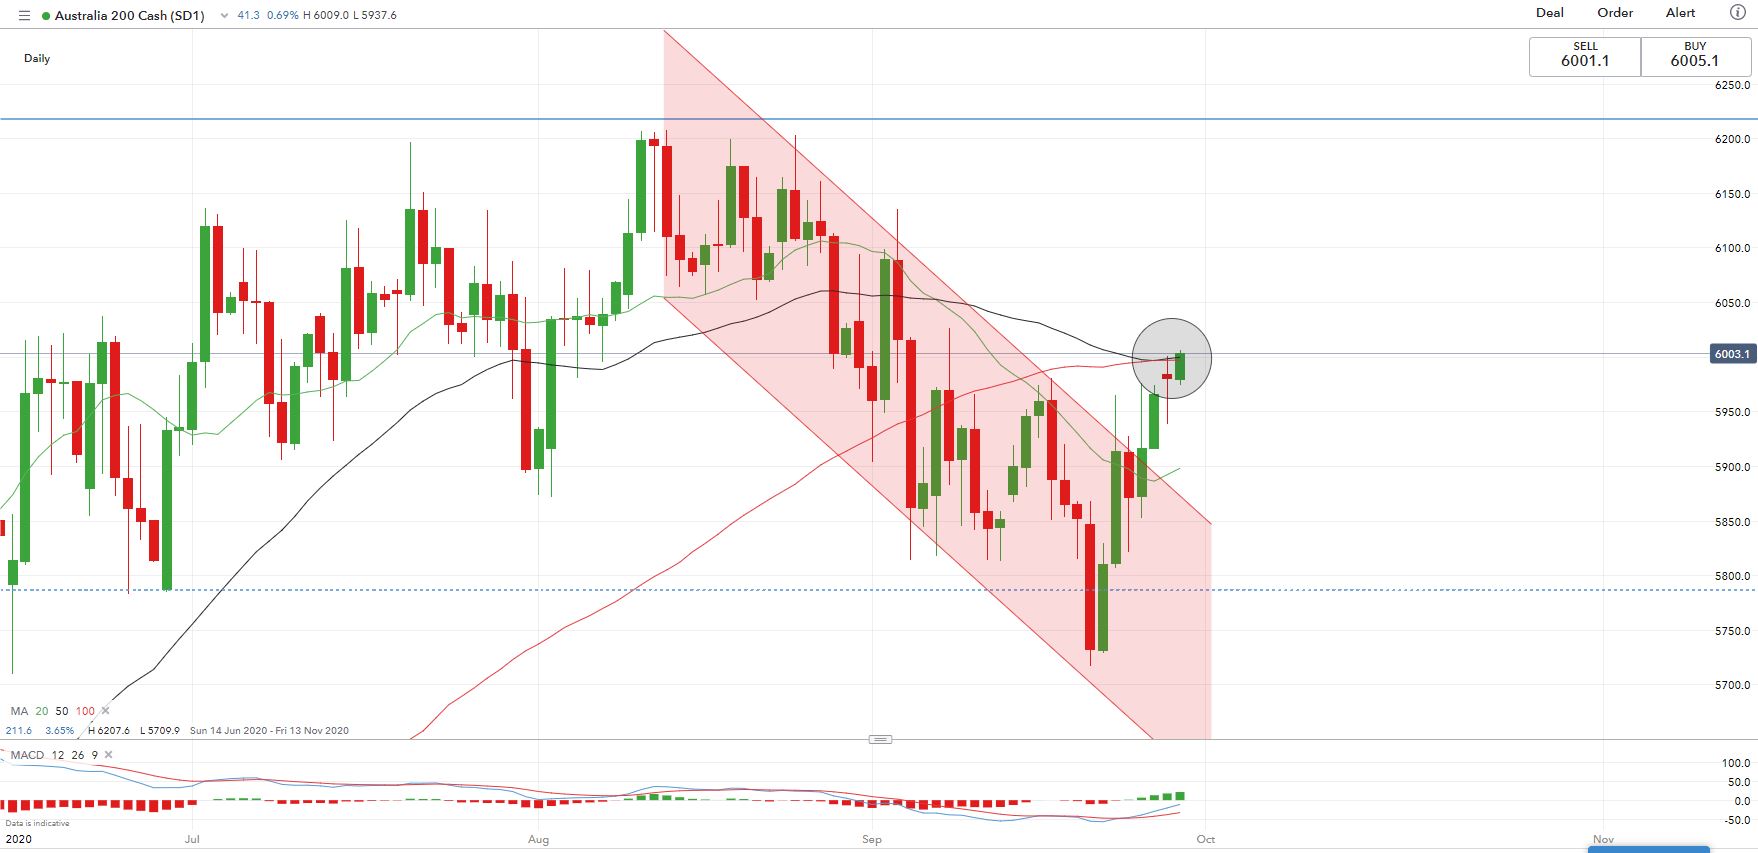
Australia’s ASX 200 index opened 0.6% higher, hitting a strong resistance at 6,000 where the 50-Day and 100-Day SMA overlaps (chart below). The short-term trend of the ASX 200 index appears biased towards the upside, as the MACD momentum suggests. An immediate support level can be found at 5,900 – the 20-Day SMA.
ASX 200 Index – Daily Chart
Nikkei 225 Index Outlook:
Japan’s Nikkei 225 index was ranging between 22,700 to 23,500 for the past few weeks, attempting for a breakthrough. With the Japanese yen little moved against the US Dollar, Nikkei may ride the ebb and flow alongside the rest of Asia-Pacific amid a quiet calendar day. In the short term, 23,500 remains a key resistance and a breakthrough above this level will likely open room for more upsides.
Nikkei 225 Index – Daily Chart


--- Written by Margaret Yang, Strategist for DailyFX.com
To contact Margaret, use the Comments section below or @margaretyjy on Twitter


